Figures & data
Figure 1 Flow chart of the algorithm.
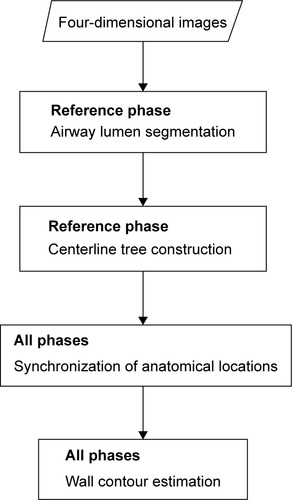
Figure 2 An example of curved multi-planar reconstruction images with and without anatomical synchronization.
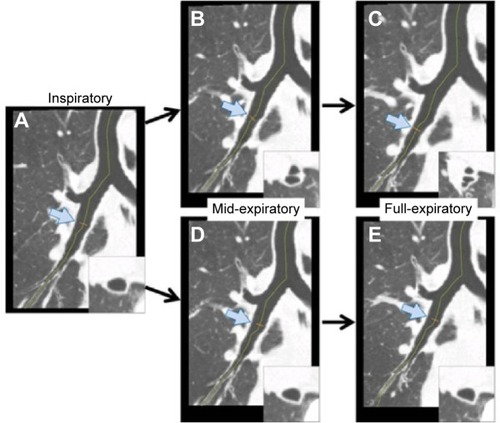
Figure 3 Illustration of the chest phantom. A porcine lung placed in the chest phantom (artiCHEST) inflates and deflates by a negative pressure cylinder.
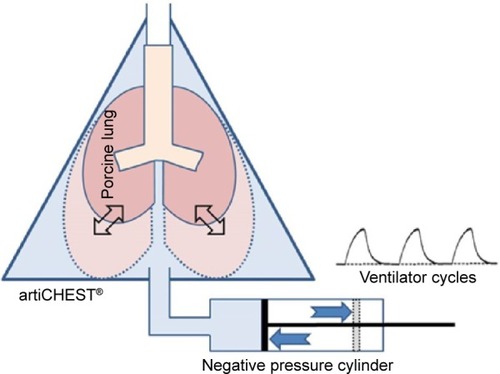
Figure 4 A sample image for the quantitative tracheal measurement provided by the software.
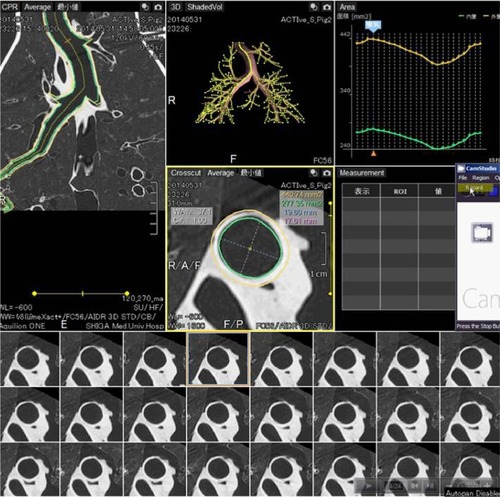
Figure 5 Continuous changes in Ai and MLD. It is obvious that the two time curves change almost simultaneously.
Abbreviations: Ai, tracheal luminal size; MLD, mean lung density; HU, Hounsfield units.
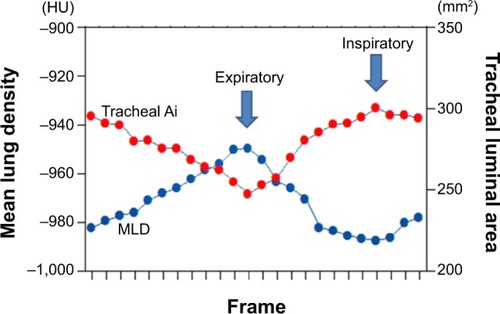
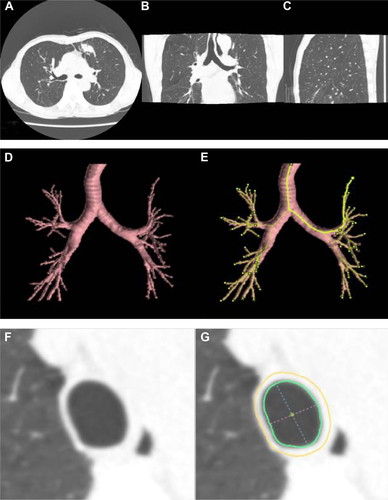
Figure S1 (A–C) Original CT images. (D) An example of airway lumen segmentation. (E) An example of centerline tree construction. (F) The original crosscut image.(G) An example of wall contour estimation (green indicates the inner wall contour, yellow indicates the outer wall contour, blue dotted line indicates the maximum diameter, and pink dotted line indicates the minimum diameter).