
Figures & data
Figure 1 Flowchart of patient enrollment.
Abbreviations: ARF, acute respiratory failure; CBC, complete blood count; ICU, intensive care unit.
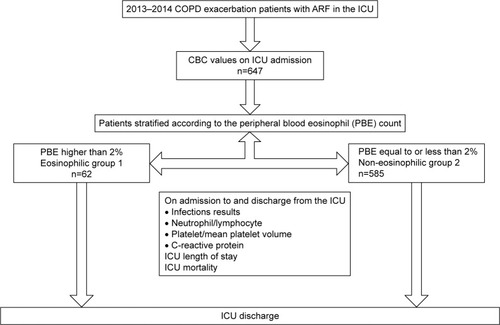
Table 1 Demographics and ICU values of study groups
Figure 2 Respiratory treatment approach and outcome for study groups.
Abbreviations: ARF, acute respiratory failure; ICU, intensive care unit; IMV, invasive mechanical ventilation; NIMV, noninvasive mechanical ventilation.
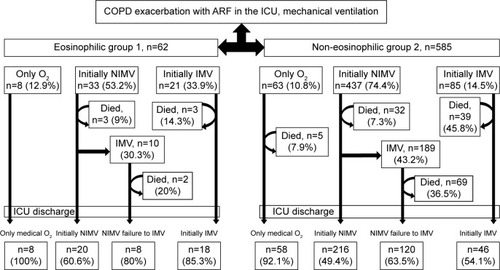
Table 2 Complete blood count values of study groups on admission to and discharge from the ICU
Table 3 Comparison of complete blood count values on admission and discharge for each group
Table 4 On the day of admission to and discharge from the ICU for CRP, neutrophil to lymphocyte ratio and platelet to MPV ratio and delta values of study groups
Table 5 Logistic regression analysis of intensive care mortality risk factors of COPD patients with acute respiratory failure