
Figures & data
Table 1 Demographic characteristics of study subjects
Table 2 Reasons for poor compliance among nonuser LTOTD-COPD patients
Table 3 The proportion of patients with cognitive impairment
Figure 1 Box plot of the MoCA scores for the two study groups.
Abbreviations: LTOTD, long-term oxygen therapy-dependent; MoCA, Montreal Cognitive Assessment.
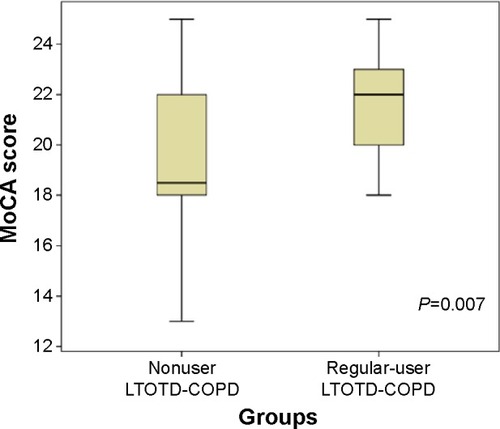
Figure 2 Box plot of the MMSE scores for the two study groups.
Abbreviations: LTOTD, long-term oxygen therapy-dependent; MMSE, Mini-Mental State Examination.
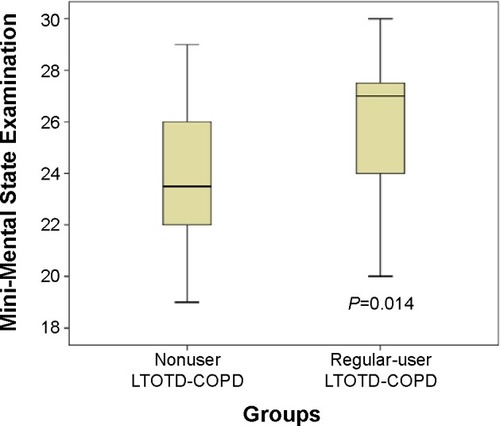
Table 4 Mean values of MoCA and MMSE scores for our study groups
Table 5 Correlation between MoCA–MMSE score and clinical parameters