Figures & data
Figure 1 Study flowchart.
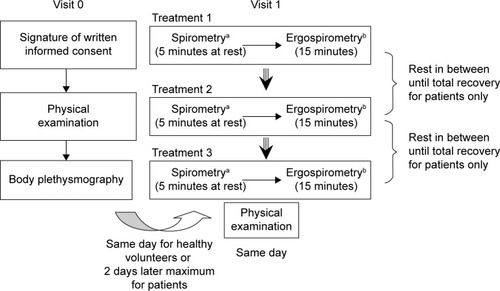
Table 1 Baseline characteristics, pulmonary function tests at rest, and pulse oximetry breathing air of the study groups
Table 2 Physiological response parameters during constant work rate exercise for the different study groups and the two gas mixtures (He/O2 78%/22% and Medical air)
Figure 2 Average of normalized oxygen uptake
/(3.5ml/kg/min × weight kg) at rest while breathing air or He/O2 mixture for the healthy, asthmatic, and COPD groups.
Note: The error bars represent standard deviation.
Abbreviations: COPD, chronic obstructive pulmonary disease;
, oxygen uptake.
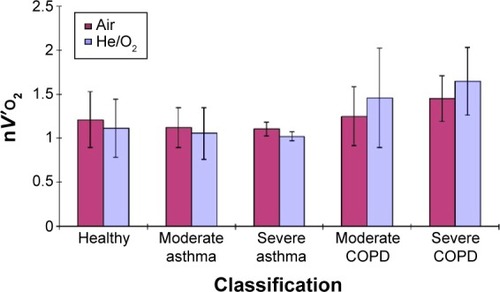
Figure 3 Average MET after submaximal exercise for each subject group.
Abbreviation: MET, metabolic equivalent.
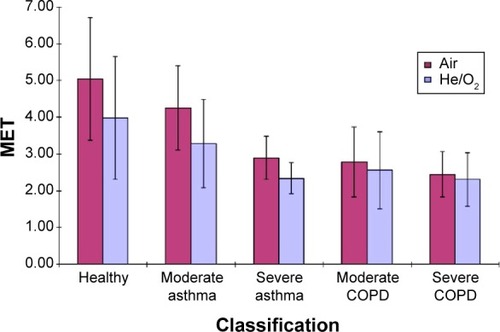
Figure 4 Individual changes in normalized oxygen uptake
/(3.5 mL/kg/min × weight kg) at rest while breathing air or He/O2 mixture.
Notes: For the subject groups solid and dashed lines are for moderate and severe cases, respectively. The bars represent the mean values. There were only 30 participants in total who completed the study, but subject numbers were assigned to other initiated patients who later dropped out while the original subject numbers are retained.
Abbreviations: COPD, chronic obstructive pulmonary disease;
, oxygen uptake.
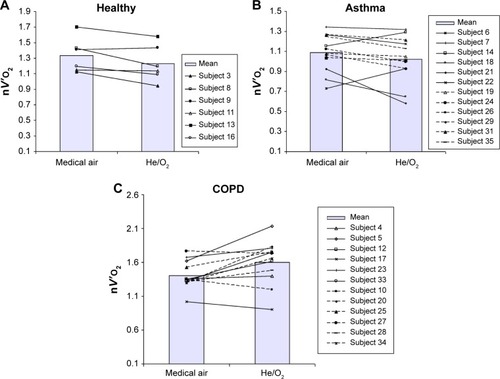
Figure 5 Individual changes in MET after submaximal exercise while breathing air or He/O2 for the (A) healthy, (B) asthmatic, and (C) COPD groups.
Notes: MET is based on
measure for each subject at rest. For the subject groups, solid and dashed lines are for moderate and severe cases, respectively. The bars represent the mean values. There were only 30 participants in total who completed the study, but subject numbers were assigned to other initiated patients who later dropped out while the original subject numbers are retained.
Abbreviations: MET, metabolic equivalent; COPD, chronic obstructive pulmonary disease; V′O2, oxygen uptake.
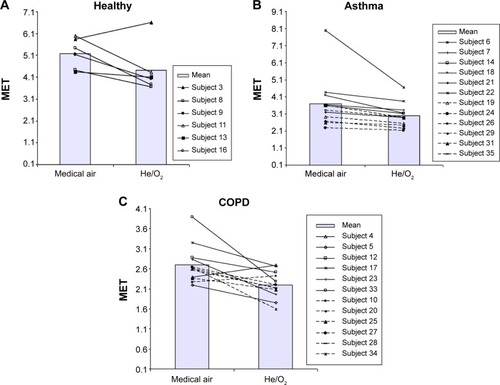
Figure 6 Individual changes in metabolic cost per unit volume of oxygen inspired after submaximal exercise breathing air and He/O2 mixtures as measured by minute ventilation divided by oxygen uptake
for the (A) healthy, (B) asthmatic, and (C) COPD groups.
Abbreviations: COPD, chronic obstructive pulmonary disease; min, minute;
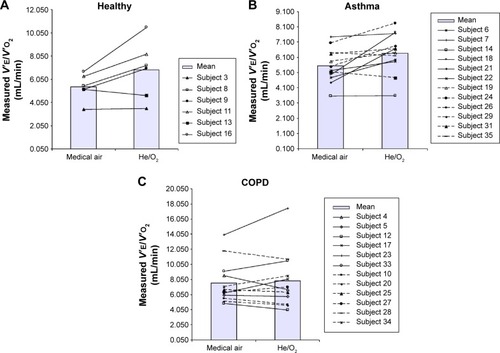
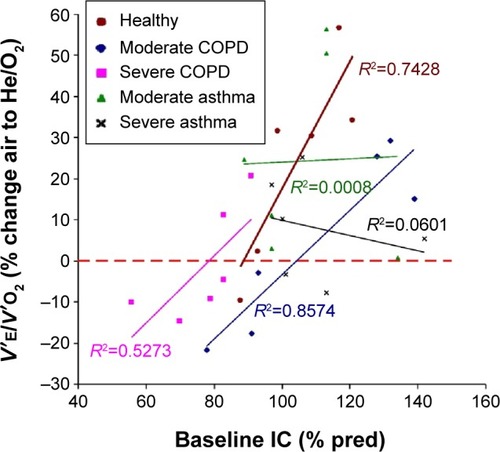
Figure 7 The change in metabolic cost of breathing from air to He/O2 for each subject and categorized by subject group plotted as a function of IC% predicted.
Abbreviations: COPD, chronic obstructive pulmonary disease; IC%, inspiratory capacity percent.