
Figures & data
Figure 1 Study design flow diagram.
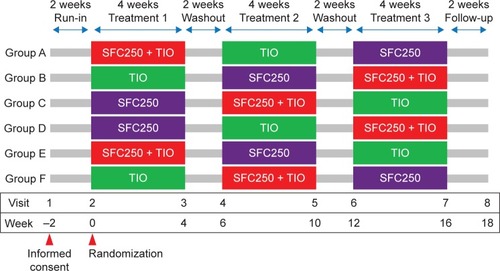
Figure 2 CONSORT flow diagram.
Abbreviations: AE, adverse event; SFC, salmeterol/fluticasone propionate; sGaw, specific airway conductance; TIO, tiotropium bromide.
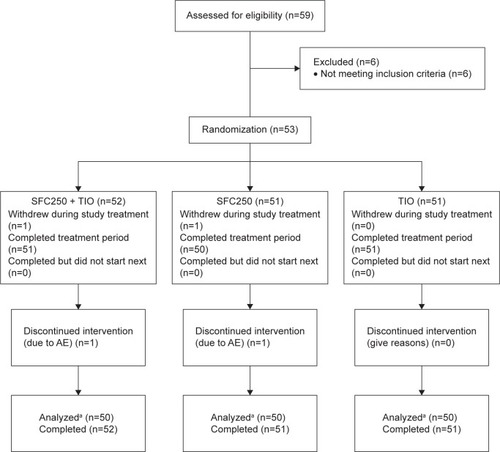
Table 1 Summary of demographics and baseline characteristics (mITT population)
Table 2 Analysis of sGaw AUC0–4h on days 1 and 28 (mITT population)
Table 3 Change from baseline in trough pulmonary function tests on day 28 (mITT population)
Figure 3 (A) sGaw, (B) FEV1, and (C) RV on days 1 and 28 of treatment.
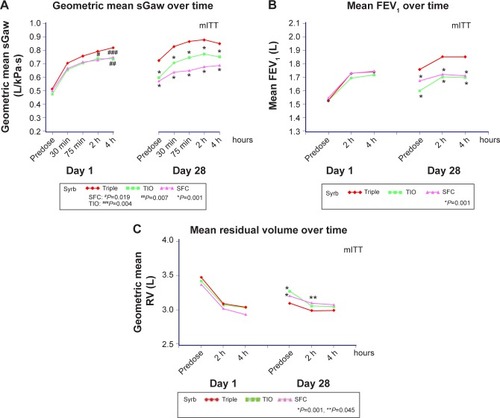
Table 4 Use of rescue medication presented as the mean number of occasions per 24-hour period
Table 5 Adverse events occurring in greater than 3% patients (safety population)\
Table S1 Change from baseline in sGaw and sRaw (mITT population)
Table S2 Postdose raw mean (standard deviation log) values of sGaw and sRaw (mITT population)
Table S3 Change from baseline pulmonary function tests (mITT population)
Table S4 Postdose raw mean (standard deviation) pulmonary function test values (mITT population)