Figures & data
Figure 1 Flow chart of patients.
Abbreviations: PBE, peripheral blood eosinophil; LTOT, long-term oxygen therapy; NLR, neutrophil-to-lymphocyte ratio; PLT/MPV, platelet-to-mean platelet volume ratio.
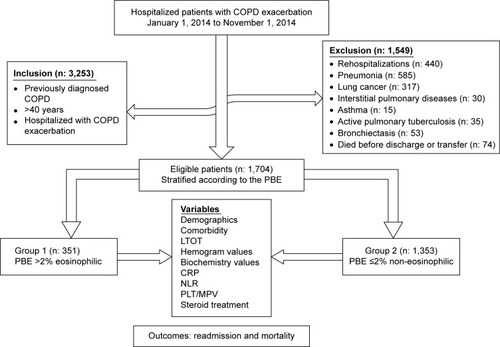
Table 1 Patients’ characteristics and laboratory findings on admission
Table 2 Laboratory findings, length of stay, and steroid use on hospital discharge
Table 3 Hospital readmission for treatment of COPD exacerbation, and mortality within 6 months after discharge
Figure 2 Eosinophilic and non-eosinophilic COPD patient survival after hospital discharge (days) as determined by Kaplan–Meier analysis.
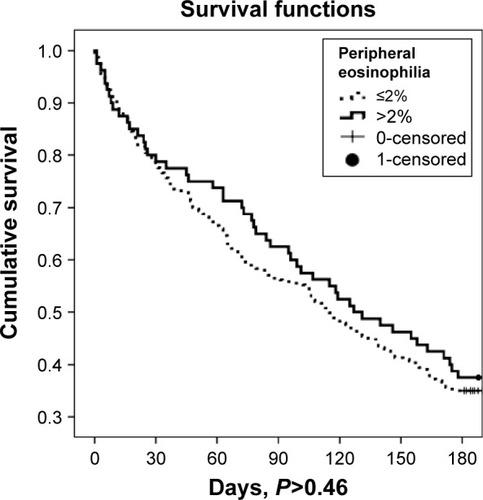
Table 4 Cox regression analysis of survival after hospital discharge
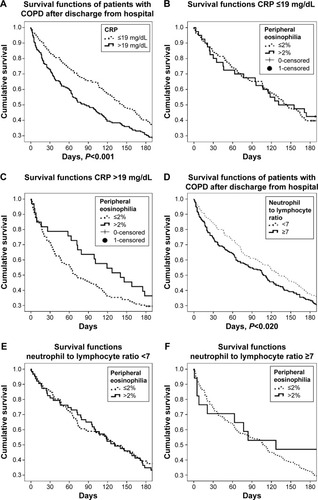
Figure 3 Survival functions of COPD patients according to CRP and NLR.
Notes: (A) CRP values above and below 19 mg/dL for 6-month survival after discharge. (B) CRP values >19 mg/dL and, (C) CRP ≤19 mg/dL had similar survival curves in both eosinophilic groups (eosinophils ≤2% and >2%) (P>0.36). (D) Kaplan–Meier survival curves show the neutrophil-to-lymphocyte ratio (NLR) <7 and ≥7 for all patients. (E) NLR ≥7 mg/dL and (F) NLR <7 had similar survival curves in both eosinophilic groups (eosinophils ≤2% and >2%) (P>0.98).