
Figures & data
Table 1 Propensity score matching results
Figure 1 Patient selection.
Notes: Patient selection (left column) and attrition (right column) after applying each inclusion and exclusion criteria in a step-wise manner, starting with over 18 million individuals identified in the HIRE during the intake period and ending with 1,198 individuals matched within each treatment group.
Abbreviations: HIRE, HealthCore Integrated Research Environment; BFC, budesonide/formoterol combination; COPD, chronic obstructive pulmonary disease; ICD-9, International Classification of Diseases, 9th Revision; ICS/LABA, inhaled corticosteroid/long-acting β2-agonist; LAMA, long-acting muscarinic antagonist; OCS, oral corticosteroid.
Abbreviations: HIRE, HealthCore Integrated Research Environment; BFC, budesonide/formoterol combination; COPD, chronic obstructive pulmonary disease; ICD-9, International Classification of Diseases, 9th Revision; ICS/LABA, inhaled corticosteroid/long-acting β2-agonist; LAMA, long-acting muscarinic antagonist; OCS, oral corticosteroid.
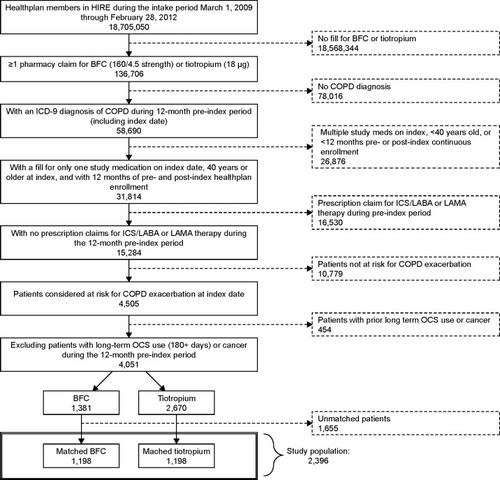
Table 2 Primary outcome, sensitivity, and subgroup analyses
Figure 2 Primary outcome - time to first exacerbation.
Notes: Time to first COPD exacerbation by index treatment cohort during the 1-year follow-up period.
Abbreviations: BFC, budesonide/formoterol combination; HR, hazard ratio; CI, confidence interval; COPD, chronic obstructive pulmonary disease.
Abbreviations: BFC, budesonide/formoterol combination; HR, hazard ratio; CI, confidence interval; COPD, chronic obstructive pulmonary disease.
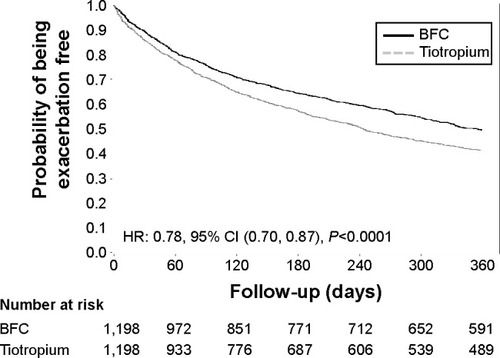
Figure 3 Exacerbation rates, counting all exacerbations during the post-index period.
Notes: Exacerbation rates allowing for multiple exacerbations during the 1-year follow-up period, overall and by exacerbation type.
Abbreviations: COPD, chronic obstructive pulmonary disease; ED, emergency department; OCS, oral corticosteroid; BFC, budesonide/formoterol combination; CI, confidence interval.
Abbreviations: COPD, chronic obstructive pulmonary disease; ED, emergency department; OCS, oral corticosteroid; BFC, budesonide/formoterol combination; CI, confidence interval.
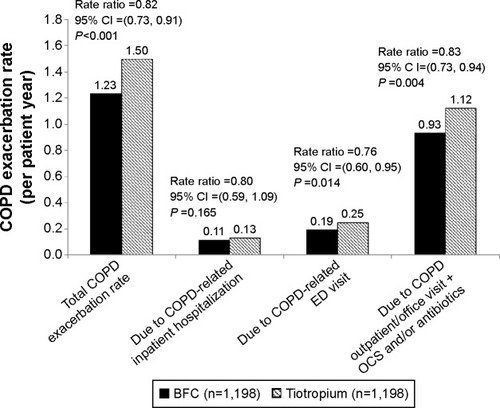
Table 3 COPD medication use – proportion of patients with at least one fill during the post-index period
Table 4 Health care resource utilization during the 12-month post-index period
Table 5 Health care costs during the 12-month post-index period