
Figures & data
Figure 1 Flowchart of the Participants’ Selection Process of the Study.
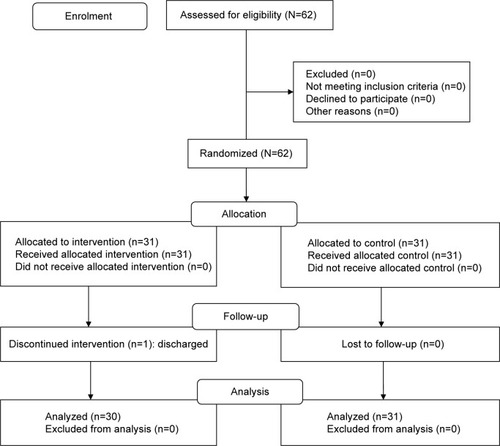
Table 1 Demographic profiles of the participants (N=61)
Table 2 Between and within groups differences on dyspnea, cough, and exercise tolerance at baseline and the end of fourth day (N=61)
Table 3 Between and within groups differences on sputum expectoration at baseline and the end of fourth day (N=61)