Figures & data
Figure 1 The augmentation index (AI) is calculated as the difference between the second (P2) and first (P1) systolic peak pressure and is expressed as percentage of the central PP: AI (%) = [(P2−P1)/PP] ×100.
![Figure 1 The augmentation index (AI) is calculated as the difference between the second (P2) and first (P1) systolic peak pressure and is expressed as percentage of the central PP: AI (%) = [(P2−P1)/PP] ×100.](/cms/asset/4f0a6792-eb8e-42cb-a89f-764fdd1f7352/dcop_a_90943_f0001_b.jpg)
Table 1 Patient characteristics
Figure 2 Study flow.
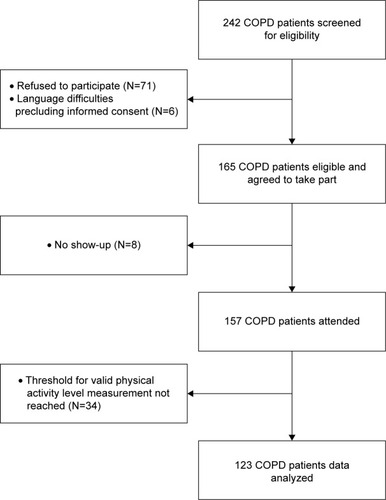
Table 2 Univariate regression analysis of possible predictors for aortic augmentation index
Table 3 Multiple regression analysis of possible predictors for aortic augmentation index
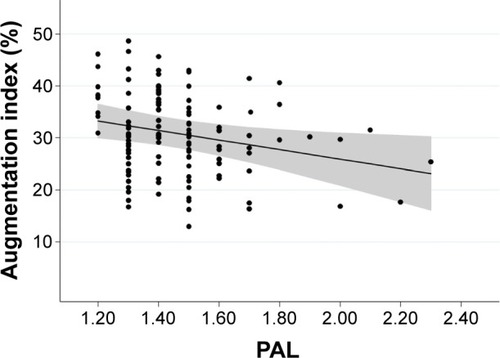
Figure 3 A scatterplot of AI and PAL adjusted for age, age × age (squared term), sex, BMI, systolic blood pressure, and FEV1 %predicted according to the final regression model is shown.
Notes: The regression line (black line) and confidence intervals (gray bar) are marked. The figure illustrates a decrease of the AI with increasing PAL in COPD patients.
Abbreviations: AI, augmentation index; PAL, physical activity level; BMI, body mass index; FEV1, forced expiratory volume in 1 second.
Abbreviations: AI, augmentation index; PAL, physical activity level; BMI, body mass index; FEV1, forced expiratory volume in 1 second.