Figures & data
Figure 1 General outline of the study.
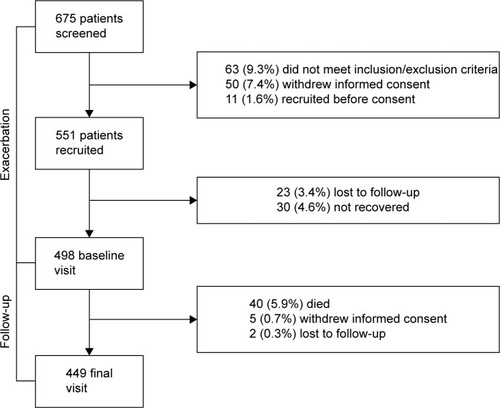
Table 1 Demographic, clinical characteristics and questionnaires’ scores
Table 2 Incidence of exacerbations, death and combined event during the 1-year follow-up
Table 3 Univariate analysis of predictive value of CAT, CCQ, COPDSS, and AQ20 scores for composite event according to the best identified cutoffs
Table 4 Predictive value of CAT, CCQ, COPDSS, and AQ20 scores for composite event, categorized into two categories as indicated
Figure 2 Kaplan–Meier curves comparing patients with CAT scores ≥13.5 points with those with CAT scores <13.5 points for the composite event.
Abbreviation: CAT, COPD Assessment Test.
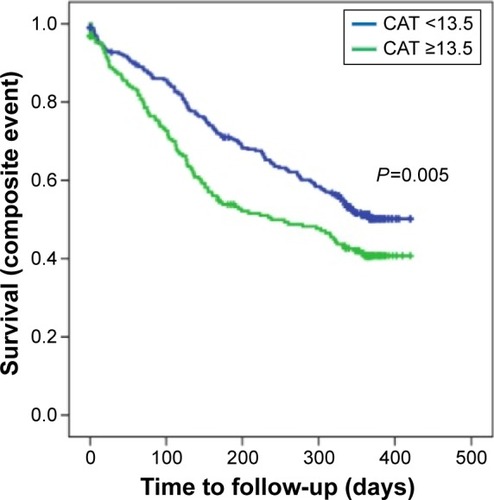
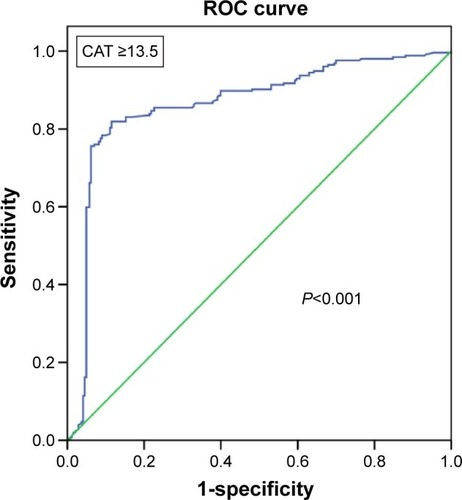
Figure 3 ROC analysis derived from the Cox regression model in its capacity to predict combined event. This model includes the number of exacerbations in the previous year and CAT ≥13.5 points (AUC =0.864, P<0.001).