
Figures & data
Table 1 Baseline characteristics of the two groups of COPD patients following SPR program and UPR program
Table 2 Relationship between baseline variables and the three outcomes of peripheral muscle strength, 30-second STST and 1-minute STST and 1-RM, in all study patients
Figure 1 Relationship between the 1-RM and the two STSTs, 30-seconds (r=0.48, P<0.001) (A) and 1-minute (r=0.36, P=0.005) (B) at baseline in 60 COPD patients.
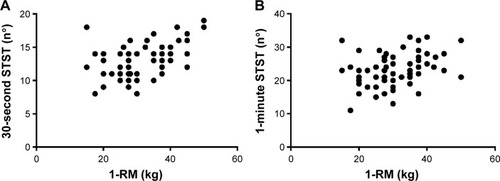
Figure 2 Plot of the percentage difference between 1-RM and 30-second STST against the mean of 1-RM and 30-second STST (A), and plot of the percentage difference between 1-RM and 1-minute STST against the mean of 1-RM and 1-minute STST (B) in 60 COPD patients.
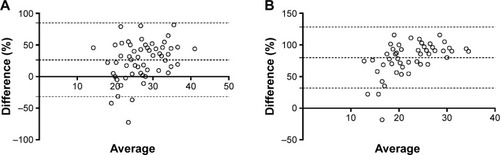
Table 3 Comparisons between the two STSTs and 1-RM with respect to VAS fatigue at the end of the test, HR, SpO2, and time required to complete the test
Table 4 Response to PR in the COPD patients following the SPR program and the UPR program