Figures & data
Figure 1 Strategies for screening patients with AECOPD.
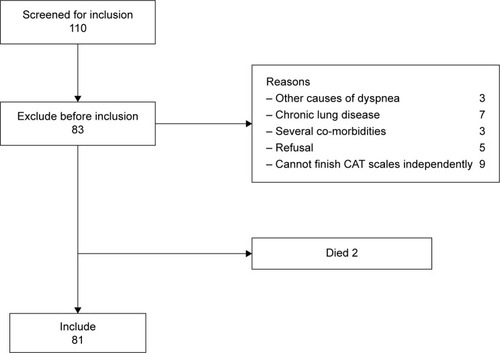
Table 1 Baseline characteristics, clinical features at study entry, and outcomes in 81 patients with COPD exacerbation
Figure 2 Viruses detected by RVP kit from the nasopharyngeal samples of 81 patients admitted for AECOPD were influenza virus (n=21), enterovirus/rhinovirus (n=11), coronavirus (n=9), bocavirus (n=6), metapneumovirus (n=5), parainfluenza virus types 1, 2, 3, and 4 (n=3), and RSV (n=3).
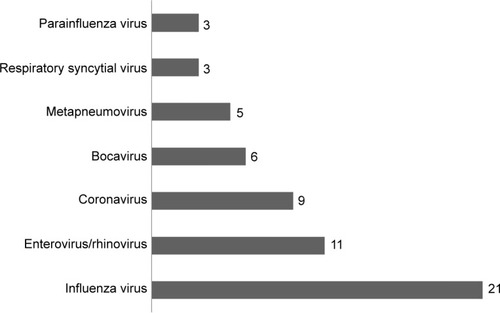
Figure 3 Statistical distribution (box plot) of LOS according to the four respiratory infectious phenotypes: 0 – non-infectious group, 1 – viral infection, 2 – bacterial infection, 3 – coinfection.
Abbreviation: LOS, length of stay.
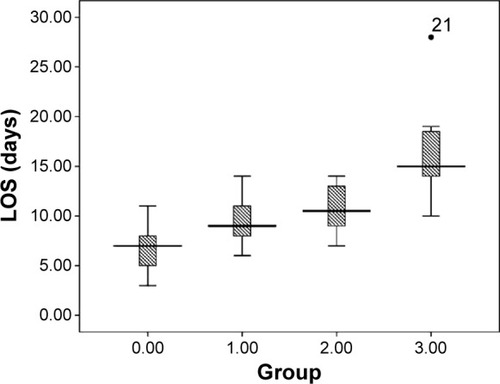
Figure 4 Statistical distribution (box plot) of CAT scores according to the four respiratory infectious phenotypes: 0 – non-infectious group, 1 – viral infection, 2 – bacterial infection, 3 – coinfection.
Abbreviation: CAT, COPD Assessment Test.
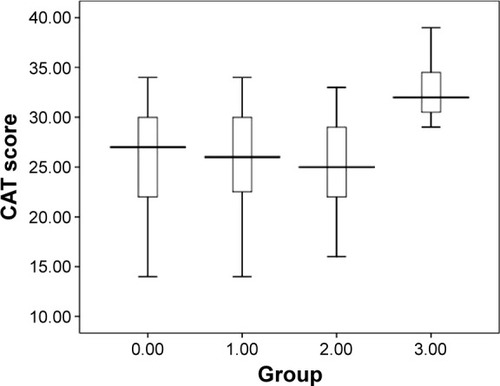
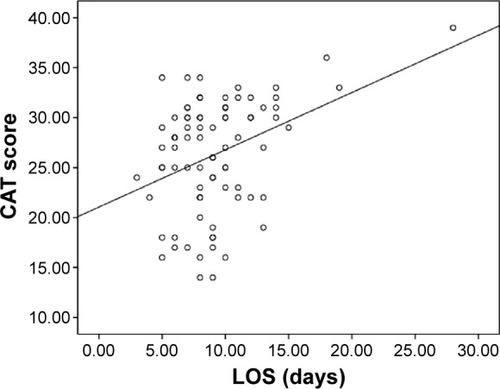
Figure 5 Pearson’s correlations between CAT and LOS.
Abbreviations: LOS, length of stay; CAT, COPD Assessment Test.