Figures & data
Table 1 Characteristics of patients with COPD and healthy subjects
Table 2 Characteristics of multigroups
Figure 1 Levels of TraIl (A) and DR5 (B) in plasma from the non-COPD group and COPD group.
Notes: Circulating TRAIL and DR5 concentrations were measured using multiplex enzyme-linked immunosorbent assay. COPD patients had significantly elevated TRAIL and DR5 levels when compared with those in healthy controls (P=0.029 and P=0.032, respectively). DR5 was log transformed in the statistical analyses. The expression of TRAIL and DR5 are presented as mean (error bar) and compared by unpaired Student’s t-test (*P<0.05).
Abbreviations: COPD, chronic obstructive pulmonary disease; DR5, decoy receptor 5; TRAIL, tumor necrosis factor-related apoptosis-inducing ligand.
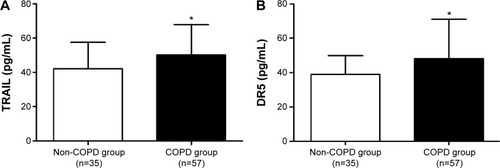
Figure 2 Multigroup analysis: TRAIL and DR5 in the plasma from the healthy nonsmokers group, healthy smokers group, COPD nonsmokers group, and COPD smokers group.
Abbreviations: COPD, chronic obstructive pulmonary disease; DR5, decoy receptor 5; NS, nonsmokers; S, smokers; TRAIL, tumor necrosis factor-related apoptosis-inducing ligand.
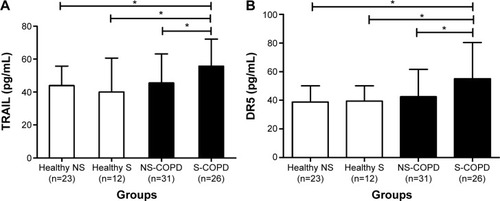
Table 3 Correlations between TRAIL, lung function, and TNF-α
Table 4 Correlations between DR5, lung function, and CRP
Figure 3 TraIl and DR5 were correlated with pulmonary function.
Notes: TraIl in the serum was inversely correlated with (A) FEV1% predicted (r=−0.354, P=0.007 for COPD; r=−0.291, P=0.005 for all participants) and (B) FEV1/FVC (r=−0.32, P=0.013 for COPD; r=−0.321, P=0.002 for all participants). DR5 was inversely correlated with (C) FEV1% predicted (r=−0.394, P=0.002 for COPD; r=−0.315, P=0.002 for total subjects) and (D) FEV1/FVC (r=−0.316, P=0.017 for COPD; r=−0.358, P=0.000 for total subjects). DR5 was log transformed in the statistical analyses. The orange solid line denotes the line of best fit in COPD, the blue line represents the line of best fit in all subjects, and Pearson’s correlation coefficient is presented as an r-value.
Abbreviations: COPD, chronic obstructive pulmonary disease; DR5, decoy receptor 5; FEV1, forced expiratory volume in 1 second; FVC, forced vital capacity; TRAIL, tumor necrosis factor-related apoptosis-inducing ligand.
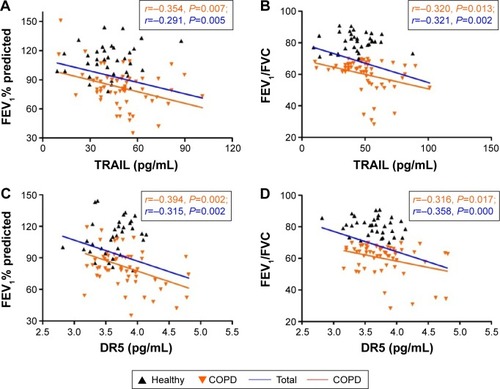
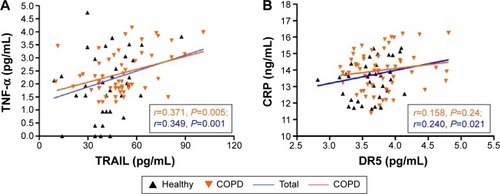
Figure 4 Correlation analyses between TRAIL/DR5 levels and established COPD biomarkers.
Abbreviations: COPD, chronic obstructive pulmonary disease; CRP, C-reactive protein; DR5, decoy receptor 5; TNF-α, tumor necrosis factor-α; TRAIL, tumor necrosis factor-related apoptosis-inducing ligand.