Figures & data
Table 1 Characteristics and blood chemistry of patients with COPD
Table 2 Within-day (session A vs session B) and between-day (session A vs session C) reproducibility of endothelial function
Figure 1 Bland–Altman analysis plots illustrating no systematic bias and good within-day reproducibility.
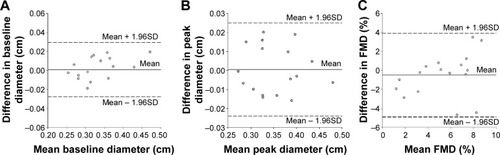
Figure 2 Bland–Altman analysis plots illustrating no systematic bias and good between-day reproducibility.
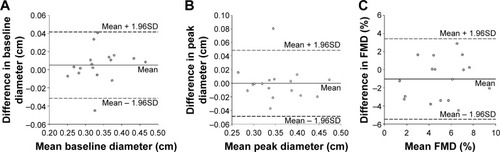
Table 3 Within-day (session A vs session B) and between-day (session A vs session C) reproducibility of arterial stiffness
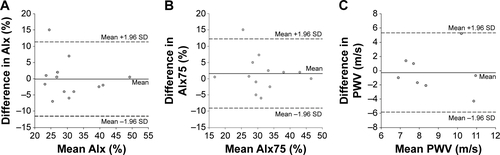
Figure S1 Bland–Altman analysis plots illustrating no systematic bias and good within-day reproducibility for (A) AIx, (B) AIx75, and (C) PWV. Notes: Solid lines represent systematic bias and dashed lines represent the 95% CI at two SD of the differences.
Abbreviations: AIx, augmentation index; PWV, pulse wave velocity; AIx75, AIx at 75 bpm.
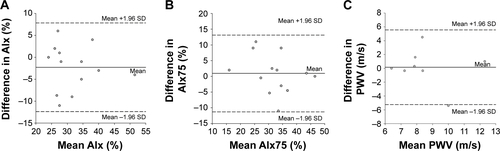
Figure S2 Bland–Altman analysis plots illustrating no systematic bias and good between-day reproducibility for (A) AIx, (B) AIx75, and (C) PWV.
Note: Solid lines represent systematic bias and dashed lines represent the 95% CI at two SD of the differences.
Abbreviations: AIx, augmentation index; PWV, pulse wave velocity; AIx75, AIx at 75 bpm.