Figures & data
Figure 1 Measurement of main pulmonary artery (MPA), right pulmonary artery (RPA), ascending aorta (AAo), and descending aorta (DAo) diameters at the level of the pulmonary artery bifurcation.
Note: MPA diameter =31.6 mm, RPA diameter =26.6 mm, AAo diameter =32.7 mm, and DAo diameter =26.6 mm.
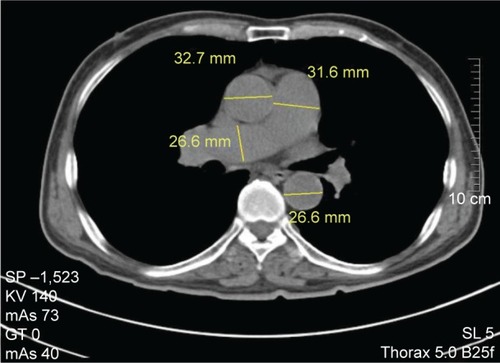
Figure 2 Measurement of left pulmonary artery (LPA) diameter at the widest part after main pulmonary artery bifurcation.
Note: LPA diameter =22.6 mm.
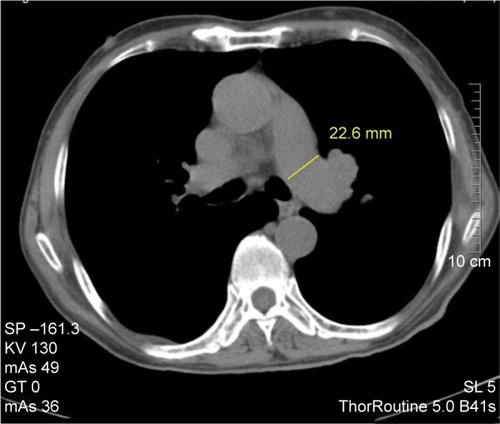
Figure 3 Receiver operating characteristic (ROC) curves showing the diagnostic accuracy of different CT measurements for COPD.
Abbreviations: CT, computed tomography; COPD, chronic obstructive pulmonary disease; MPA, main pulmonary artery; RPA, right pulmonary artery; LPA, left pulmonary artery; AAo, ascending aorta; DAo, descending aorta.
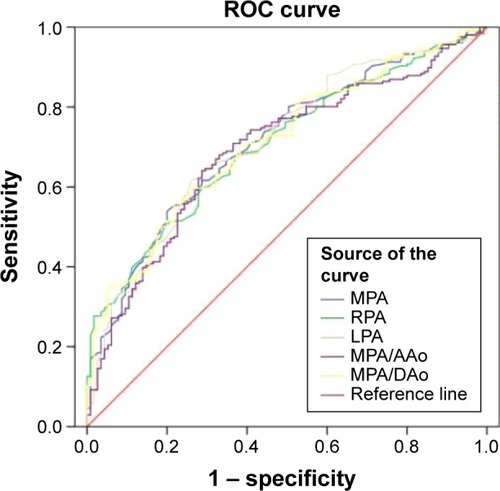
Table 1 Demographics, blood, and CT comparisons for COPD
Table 2 Area under the curve
Table 3 Demographics, blood, and CT comparisons for COPD patients with or without PH
Table 4 Area under the curve for PH
Figure 4 Receiver operating characteristic (ROC) curves showing the diagnostic accuracy of different CT measurements for COPD-PH.
Abbreviations: CT, computed tomography; COPD, chronic obstructive pulmonary disease; PH, pulmonary hypertension; MPA, main pulmonary artery; RPA, right pulmonary artery; LPA, left pulmonary artery; AAo, ascending aorta; DAo, descending aorta.
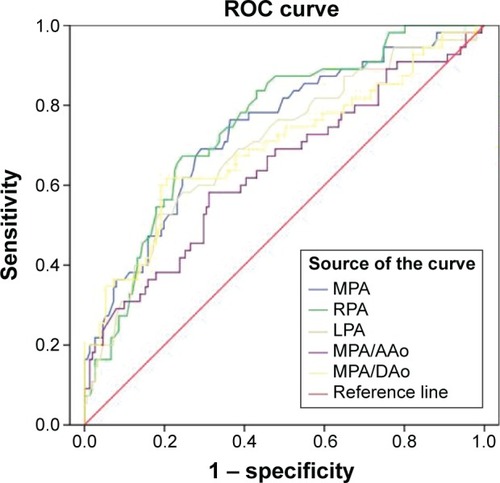
Table 5 CT measured indexes and sPAP in linear regression analysis
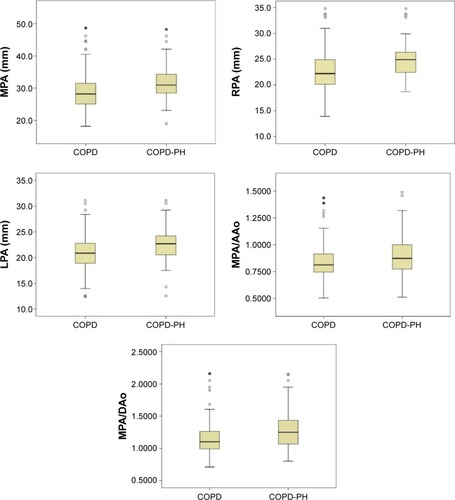
Figure 5 Comparison of MPA, RPA and LPA diameters, and MPA/AAo and MPA/DAo between COPD (non-PH) and COPD-PH.
Abbreviations: COPD, chronic obstructive pulmonary disease; PH, pulmonary hypertension; MPA, main pulmonary artery; RPA, right pulmonary artery; LPA, left pulmonary artery; AAo, ascending aorta; DAo, descending aorta.