
Figures & data
Figure 1 Patient selection in the database.
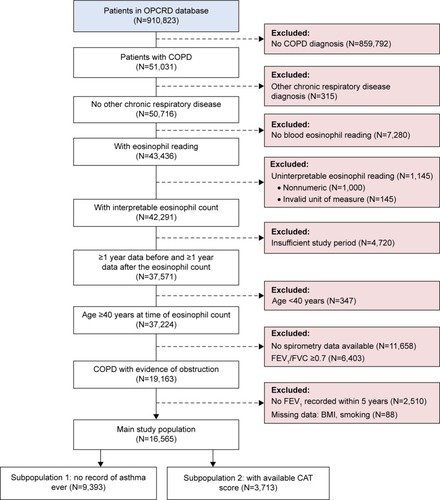
Table 1 Baseline characteristics of all patients and of the two subpopulations
Table 2 Number of exacerbations in baseline and outcome years
Table 3 Univariable predictors of two or more COPD exacerbations in the outcome year in the total population data set (N=16,565)
Table 4 Significant multivariable predictors of two or more COPD exacerbations in the outcome year in the total population data set (N=16,565)
Figure 2 Calibration plot of observed versus predicted risk using the full developmental model (N=16,565).
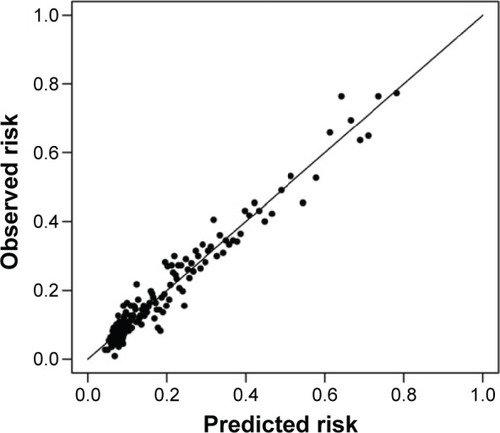
Table 5 Significant multivariable predictors of two or more COPD exacerbations in the outcome year among subpopulations
Figure 3 Calibration plot (25 groups of 108–109 observations) of the observed versus predicted risk after applying the model to the validation cohort (N=2,713).
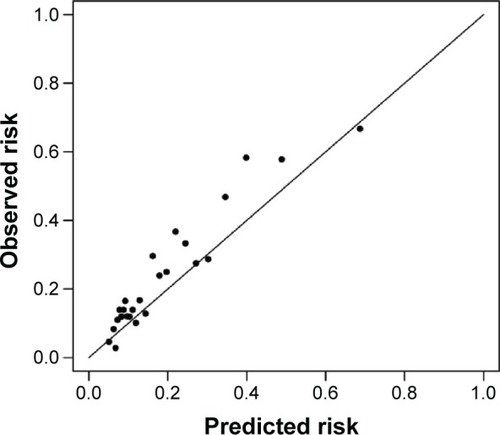
Table S1 Baseline mMRC scores, DOSE index scores, and GOLD groups based on mMRC score
Table S2 Baseline characteristics of the validation cohort