
Figures & data
Figure 1 Plots of observed glucose concentrations (open circles), population model predictions (dotted line), and individual model predictions (solid line) from the dose–fasting glucose concentration PKPD model for glucose response to glibenclamide.
Abbreviation: PKPD, pharmacokinetic/pharmacodynamic.
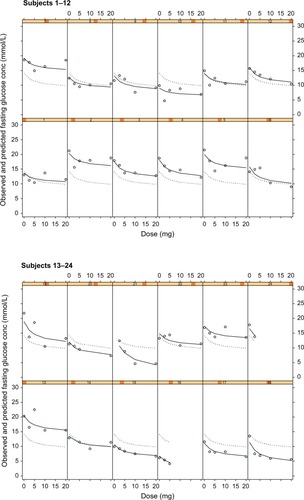
Figure 2 Plots of observed glucose concentrations (open circles), population model predictions (dotted line), and individual model predictions (solid line) for the steady state concentration (CPss) fasting glucose concentration PKPD model for glucose response to glibenclamide.
Abbreviation: PKPD, pharmacokinetic/pharmacodynamic.
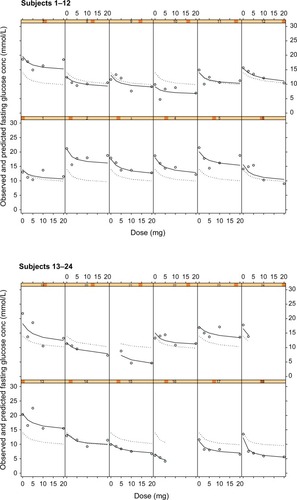
Table 1 Population pharmacokinetic/pharmacodynamic parameters for Models 1 and 2: fasting blood glucose as the pharmacodynamic response
Figure 3 Plots of observed glucose concentrations (open circles), population model predictions (dotted line), and individual model predictions (solid line) for the steady state concentration (Cpss)-mean glucose concentration PKPD model for glucose response to glibenclamide.
Abbreviation: PKPD, pharmacokinetic/pharmacodynamic.
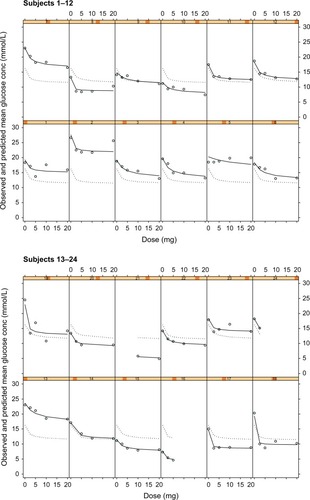
Table 2 Population pharmacokinetic/pharmacodynamic parameters for Models 3 and 4: mean blood glucose as the pharmacodynamic response
Figure 4 Plots of observed glucose concentrations (open circles), population model predictions (dotted line), and individual model predictions (solid line) for the Cpss–full glucose profile PKPD model.
Abbreviations: PKPD, pharmacokinetic/pharmacodynamic; Cpss, steady-state glibenclamide concentration.
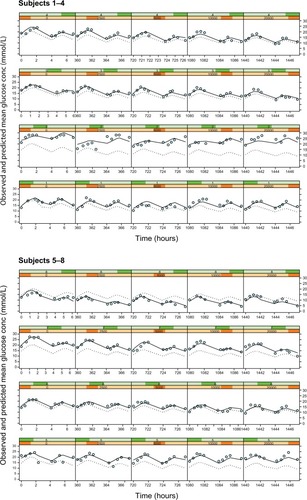
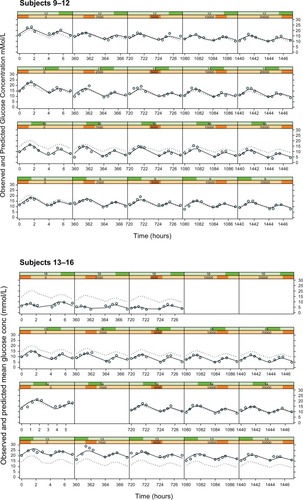
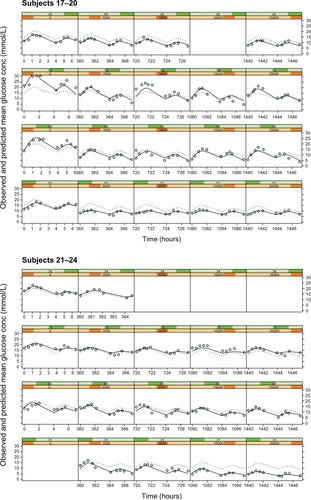
Table 3 Population pharmacokinetic/pharmacodynamic parameters for the Models 5 and 6: full glucose profile as the pharmacodynamic response