Figures & data
Table 1 Comparison between the zones of inhibition (mm) of ciprofloxacin (100 µg/mL) alone and ciprofloxacin with 100 µM vorinostat against standard bacterial strains
Table 2 Comparison between the minimum inhibitory concentrations (MICs; µg/mL) of ciprofloxacin alone and ciprofloxacin in the presence of 100 µM vorinostat against standard bacterial strains
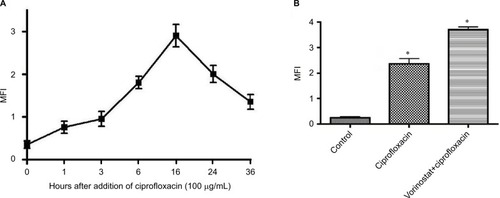
Figure 1 Ciprofloxacin-induced antibacterial action on Escherichia coli cells is preceded by a time-dependent reactive oxygen species (ROS) generation.
Notes: (A) Mean fluorescence intensity (MFI) was shown as the ratio of geometric mean fluorescence intensity of the test sample and the corresponding control. Data shown are representative of three individual experiments. (B) Pretreatment of E. coli cells with vorinostat (100 µM) for 16 hours enhanced ciprofloxacin-induced ROS generation; 2′,7′-dichlorofluorescein diacetate (DCF-DA; 10 µM) was added for the last 30 minutes of incubation. The intensity of DCF-DA fluorescence was determined using flow cytometry, with an excitation wavelength of 480 nm and an emission wavelength of 530 nm. Data shown are representative of three individual experiments. *Significant difference from the control, and ciprofloxacin-only treated groups (one-way ANOVA followed by Tukey’s post hoc test, p<0.05 in each case).