
Figures & data
Table 1 Summary of Demographic Characteristics
Table 2 Summary of Treatment-Emergent Adverse Events (TEAEs), Safety Set
Figure 1 Mean (SD) plasma concentration–time profiles of ATI-450 after a single dose under fasted conditions, semi-log scale. Hour 0 is the pre-dose value.
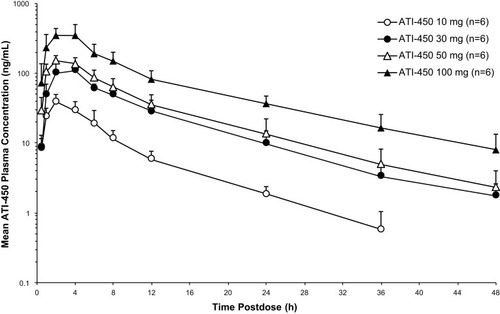
Table 3 ATI-450 Pharmacokinetic Parameters
Figure 2 Mean (SD) plasma concentration–time profiles of ATI-450 after 7 days of BID dosing under fasted conditions, semi-log scale. Hour 0 is the pre-dose value.
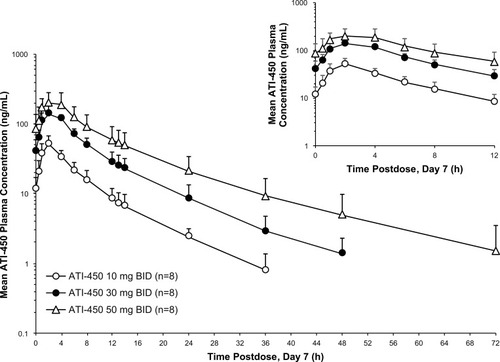
Figure 3 Mean (± SEM) cytokine and biomarker levels for (A) TNF-α, (B) IL-1β, (C) IL-6, (D) IL-8, and (E) p-HSP27 in the BID dosing cohorts comparing day 1 pre-dose values (set to 100%) with day 7 values 4 hours post-dose (approximate Cmax) and 12 hours post-dose (Ctrough).
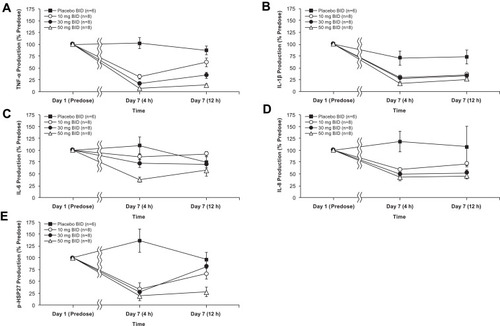
Table 4 Cytokine and Biomarker IC80 Values and Multiples Across the Dosing Interval in the 50 mg BID Dose Cohort