Figures & data
Figure 1 Graphical examinations of observable trends between relevant popPK parameters and covariates. Box plot of apparent clearance (CL/F, A) and apparent volume of distribution of the central compartment (V2/F, B) of CC-122 by tumor types. (C) Scatter plot of apparent clearance (CL/F) vs creatine clearance (CLcr). (D) Scatter plot of apparent volume of distribution of the central compartment (V2/F) vs body weight. (E) Box plot of apparent volume of distribution of the central compartment (V2/F) by sex. Individual estimates of CL/F and V2/F were obtained from the base model.
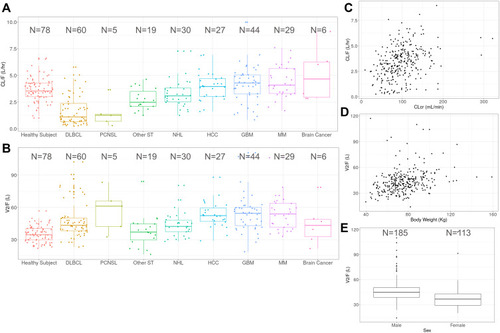
Table 1 Demographic and Baseline Characteristics of 298 Subjects from CC-122-CP-002, CC-122-CP-005 and CC-122-ST-001 Studies
Figure 2 Individual dose-normalized CC-122 concentration vs time profiles by studies. Red: CC-122-ST-001 study; Green: CC-122-CP-002 study; Blue: CC-122-CP-005 study.
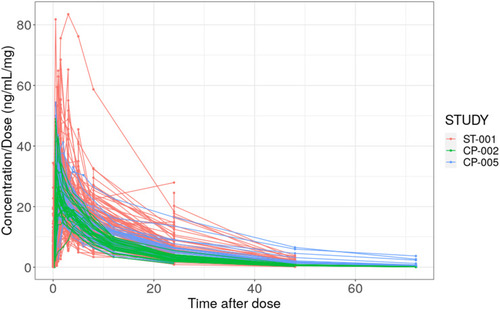
Figure 3 The population pharmacokinetic model of CC-122. The model comprises two-compartment with first-order absorption incorporating a lag time and first-order elimination.
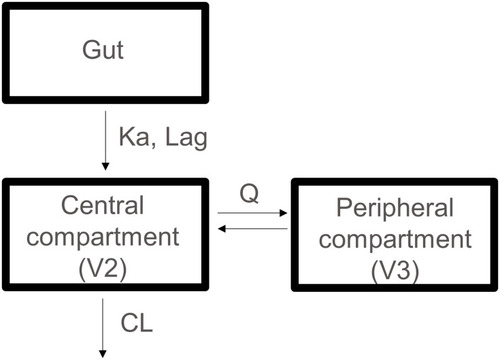
Figure 4 Forest plot of significant covariates on apparent clearance (CL/F, A) and apparent volume of distribution of the central compartment (V2/F, B) of CC-122. Data are shown as median (90% confidence interval). (A) References are healthy subject (tumor type) and creatinine clearance (CLcr) ≥90 mL/min (CLcr). (B) References are healthy subject (tumor type), male (gender) and second tertile of body weight at baseline (Body weight). First, second and third tertile of body weight at baseline are 39.8–68.0 kg, 68.2–81.6 kg and 81.9–159.0 kg, respectively.
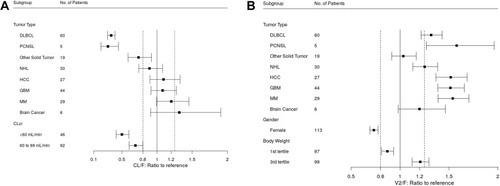
Table 2 Population Pharmacokinetic Parameter Estimates of CC-122 from the Final Model
Figure 5 Visual predictive check for plasma CC-122 concentration (log transform) vs time profiles. Circles represent observed data. Lines represent the 5th (solid blue), 50th (solid red), and 95th (solid blue) percentiles of the observed data. Shaded areas represent nonparametric 90% confidence intervals about the 5th (blue), 50th (red), and 95th (blue) percentiles for the corresponding model-predicted percentiles.
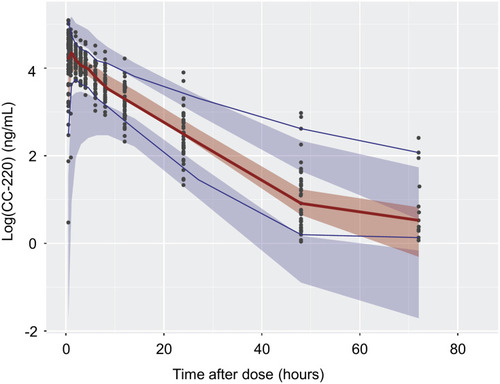
Figure 6 Goodness-of-fit plots of the final population pharmacokinetic model of CC-122. The black line represents the identity line or zero line. The red line represents the locally weighted scatterplot smoothing line. (A) Observed concentration vs individual predicted concentration. (B) Observed concentration vs population predicted concentration. (C) Conditional weighted residual vs population predictions. (D) Conditional weighted residual vs time.
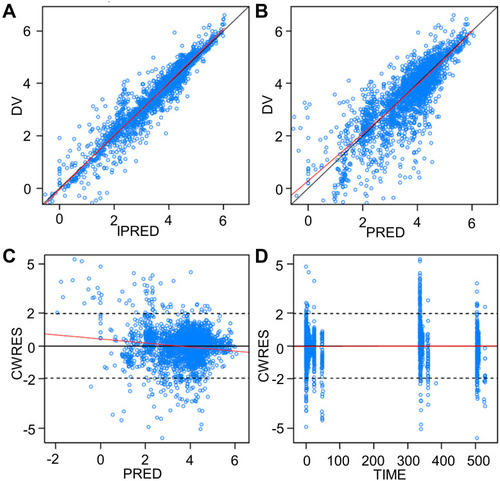
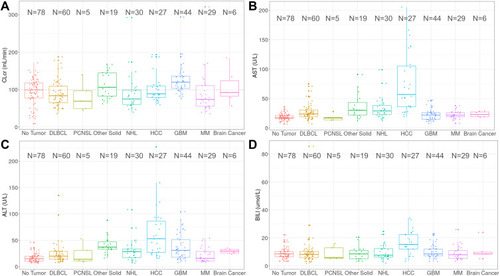
Figure 7 Box plot of baseline creatinine clearance (CLcr, A) aspartate aminotransferase (AST, B) alanine aminotransferase (ALT, C) and bilirubin (BILI, D) by tumor types. The number of subjects were presented.