Figures & data
Figure 1 Study flow chart.
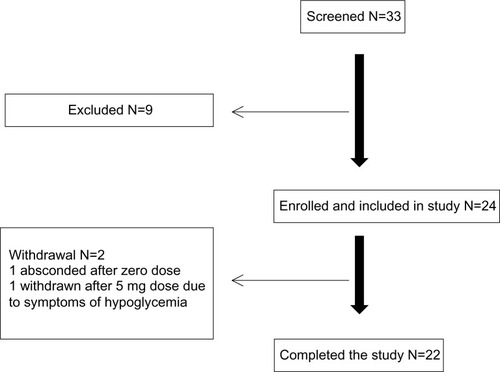
Table 1 Cohort characteristics at entry into the study
Figure 2 Mean plasma glibenclamide concentration versus dose.
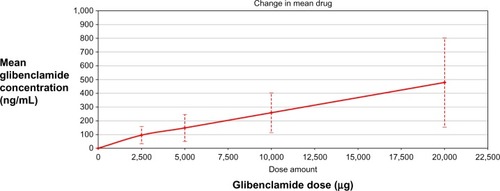
Figure 3 Mean blood glucose concentration versus dose of glibenclamide.
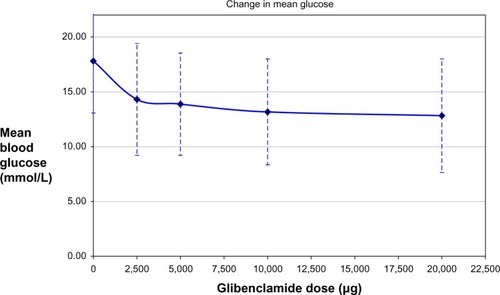
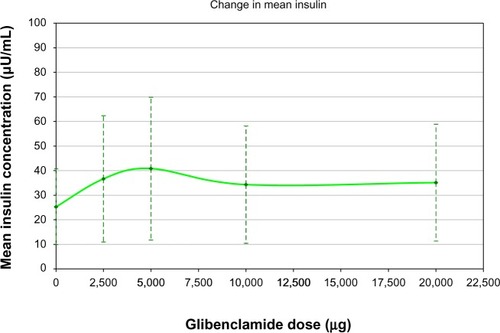
Figure 4 Mean insulin concentration versus dose of glibenclamide.