
Figures & data
Table 1 Clinical characteristics of the patients
Figure 1 Changes in blood pressure (A) and eGFR (B) of a total of 107 patients from the baseline compared with 12 months’ irbesartan treatment.
Abbreviations: DBP, diastolic blood pressure; eGFR, estimated glomerular filtration rate; SBP, systolic blood pressure.
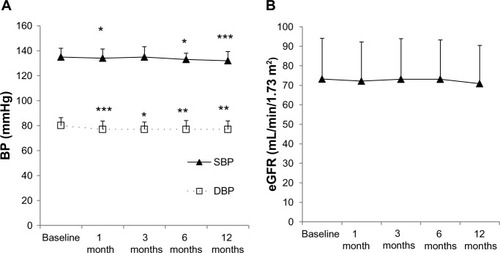
Figure 2 Mixed-linear model plots for SUA changes of patients classified according to SUA baseline value (<5.9 mg/dL (A) or ≥5.9 mg/dL (B)). Estimated marginal means of SUA were plotted from SUA at 0–12 months in covariance with diabetic disease duration.
Abbreviation: SUA, serum uric acid.
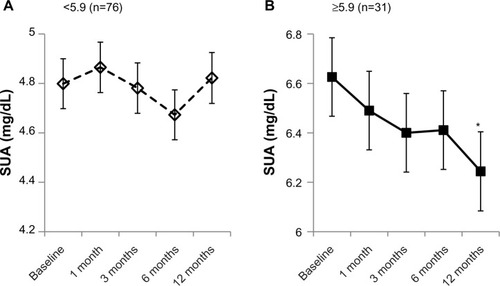
Figure S1 ROC analysis of SUA baseline values.
Notes: Decrease of SUA over 12 months was set to a positive influence and specificity and sensitivity of SUA baseline value were plotted. The cutoff point of SUA when the sum of specificity and sensitivity is maximized was 5.9 mg/dL (specificity, 0.860; sensitivity, 0.414). Area under the curve: 0.6540 and 95% CI: 0.5510–0.7569.
Abbreviations: CI, confidence interval; ROC, receiver operating characteristic; SUA, serum uric acid.
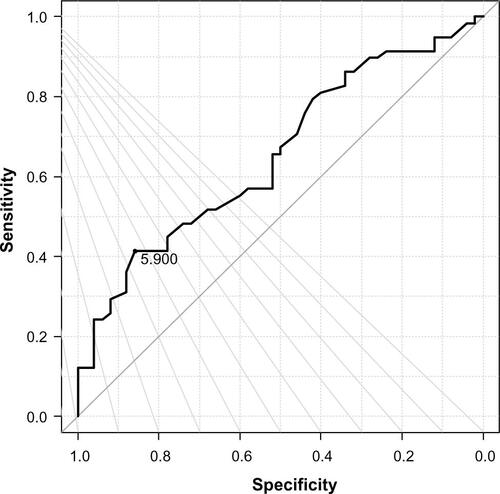
Table S1 SUA changes of the ARBs–IRB switch group by the pre-treatment of ARBs
Table S2 The baseline values of the subjects classified with the stages of diabetic nephropathy
Table S3 SUA changes from baseline after 6–12 months of irbesartan treatment
Table S4 Logistic regression analysis of the factors associated with SUA decline