Figures & data
Table 1 Comparison of NAMR Cmax in clinical trials and ratio to in vitro resultsTable Footnotea
Figure 1 Study design of digoxin and EZG/RTG up-titration.
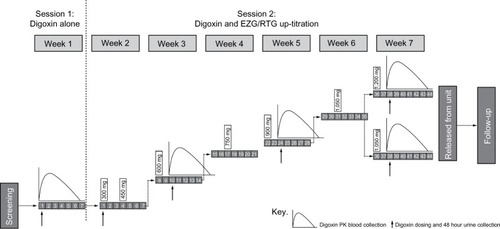
Table 2 Summary of digoxin pharmacokinetic parameters
Figure 2 Plasma AUC0–120 and renal clearance.
Abbreviations: AUC, area under concentration–time curve; CI, confidence interval; EZG, ezogabine; PK, pharmacokinetics; RTG, retigabine.
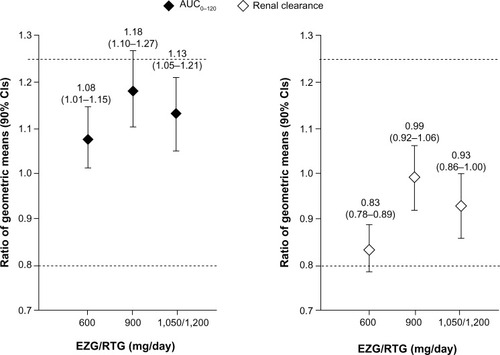
Table 3 Summary of statistical analysis assessing the effect of EZG/RTGNAMRon the pharmacokinetics of digoxin
Table 4 Summary of the most frequent adverse events (affecting ≥20% of participants during the entire study; safety population)
Figure S1A NAMR AUC0–8 versus digoxin AUC ratio.
Note: Each subject had multiple observations corresponding to the doses of EZG/RTG that they received in combination with digoxin.
Abbreviations: AUC, area under the concentration–time curve; EZG, ezogabine; NAMR, N-acetyl metabolite of EZG/RTG; RTG, retigabine.
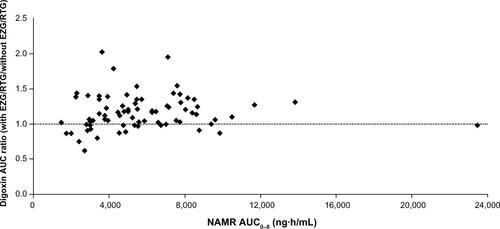
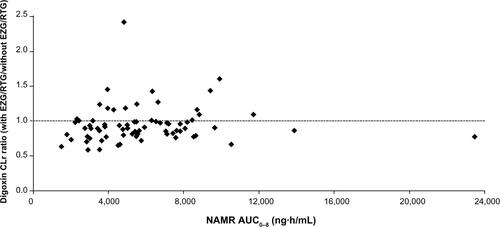
Figure S1B NAMR AUC0–8 versus digoxin renal clearance ratio.
Note: Each subject had multiple observations corresponding to the doses of EZG/RTG that they received in combination with digoxin.
Abbreviations: AUC, area under the concentration–time curve; CLr, renal clearance; EZG, ezogabine; NAMR, N-acetyl metabolite of EZG/RTG; RTG, retigabine.