
Figures & data
Figure 1 Study design.
Notes: End of pharmacokinetic sampling occurred at days 7 and 21. End of study evaluation was performed 14 (±2) days after everolimus administration in the second time period.
Abbreviation: R, randomization.
Abbreviation: R, randomization.
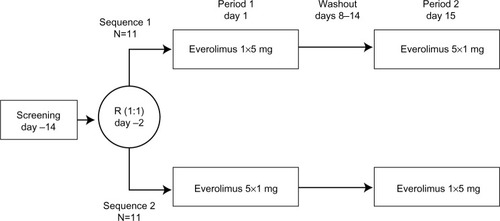
Table 1 Baseline characteristics
Figure 2 Arithmetic mean (SD) blood concentration–time profiles from 0 to 4 hours for everolimus administered as five 1 mg tablets and as one 5 mg tablet (PK population, N=22).
Abbreviations: PK, pharmacokinetics; SD, standard deviation.
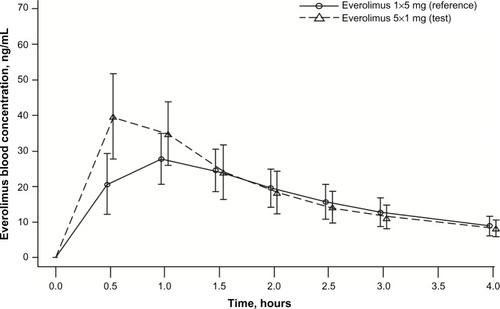
Table 2 Relative bioavailability of everolimus one 5 mg tablet versus five 1 mg tablets (PK population, N=22)
Figure 3 Arithmetic mean (SD) blood concentration–time profiles for everolimus administered as five 1 mg tablets and as one 5 mg tablet (PK population, N=22).
Abbreviations: PK, pharmacokinetics; SD, standard deviation.
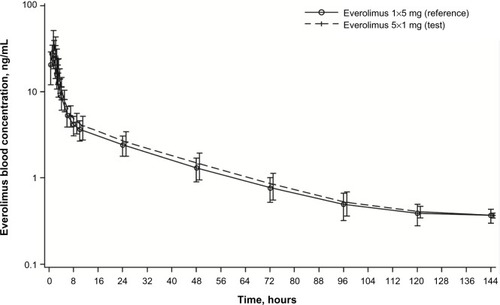
Table 3 Summary of secondary PK parameters of everolimus by treatment (PK population, N=22)
Table 4 Number of subjects who experienced adverse events, regardless of study drug relationship (safety population, N=22)