Figures & data
Table 1 Treatment cohorts and periods
Table 2 Summary of demographics and baseline characteristics
Figure 1 Fasted concentration-time profile of pexmetinib represented in semi-logarithmic scale. The in vitro half maximal inhibitory concentration (IC50) of ARRY-614 for both p38 and Tie2 is included for reference (solid line). Points represent geometric mean values and error bars ± 1 geometric standard deviation.
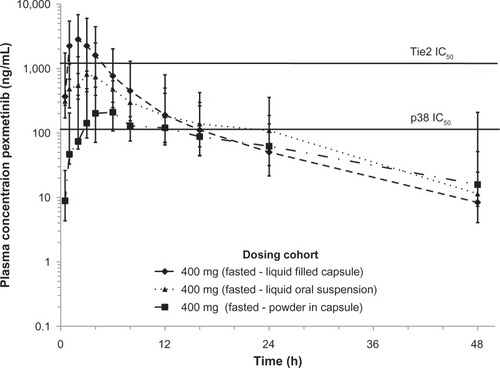
Table 3 Summary of fed and fasted plasma PK parameters of ARRY-614
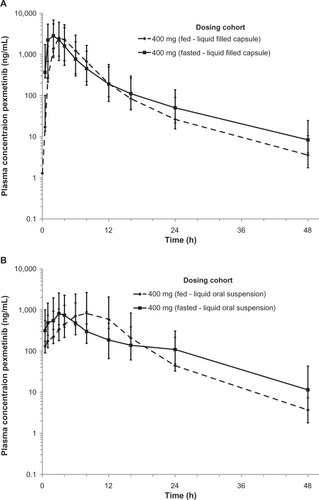
Figure 2 Concentration-time profile of pexmetinib comparing exposure in both fed and fasted states for both the LFC (A) and LOS (B) represented in semi-logarithmic scale. Points represent geometric mean values and error bars ± 1 geometric standard deviation.
Abbreviations: LOS, liquid oral suspension; LFC, and liquid-filled capsule.