Figures & data
Figure 1 General mechanism of the collagen-induced arthritis (CIA) rat model treated by paeoniflorin through downregulation of asporin (ASPN) and leukemia inhibitory factor receptor (LIFR).
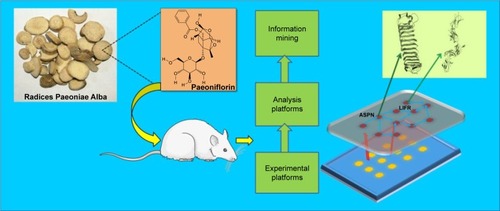
Figure 2 The severity index in the collagen-induced arthritis (CIA) rats pre- and post-treatment. Clinical arthritis scores (A) and serum inflammatory cytokine levels (tumor necrosis factor-alpha [TNF-α], interleukin [IL-1β]) (B) were compared among the normal group, the CIA group and the paeoniflorin (PA) group. Hind foot arthritis parameters were measured following 0, 21, 28, 35 and 42 days after immunization (n=10), serum inflammatory cytokines were measured following 42 days after immunization (n=5). #p<0.01 CIA versus PA; *p<0.01 CIA versus normal; ♦p<0.01 CIA versus PA.
![Figure 2 The severity index in the collagen-induced arthritis (CIA) rats pre- and post-treatment. Clinical arthritis scores (A) and serum inflammatory cytokine levels (tumor necrosis factor-alpha [TNF-α], interleukin [IL-1β]) (B) were compared among the normal group, the CIA group and the paeoniflorin (PA) group. Hind foot arthritis parameters were measured following 0, 21, 28, 35 and 42 days after immunization (n=10), serum inflammatory cytokines were measured following 42 days after immunization (n=5). #p<0.01 CIA versus PA; *p<0.01 CIA versus normal; ♦p<0.01 CIA versus PA.](/cms/asset/1a60e919-8fb5-44e6-ad8a-f6d093582fd6/dddt_a_12181620_f0002_c.jpg)
Table 1 Differentially expressed proteins identified by iTRAQ-based quantitative proteomics
Figure 3 The top bio-functions of collagen-induced arthritis (CIA) day 42 versus normal (N) control day 42 versus paeoniflorin (PA) day 42 by ingenuity pathway analysis (IPA). Orange: the top function from the diseases and disorders category; green: the top function from physiological system development and functions category; blue: the top function from the molecular and cellular functions category.
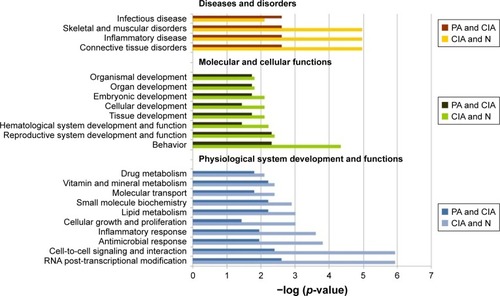
Figure 4 The pathways of the significant differentially expressed proteins (DEPs) of the collagen-induced arthritis (CIA) group and the paeoniflorin (PA) group. Top 25 canonical pathways using ingenuity pathway analysis in CIA on day 42, −log (p-value) >0.8. Twenty-one pathways were involved with PA treatment.
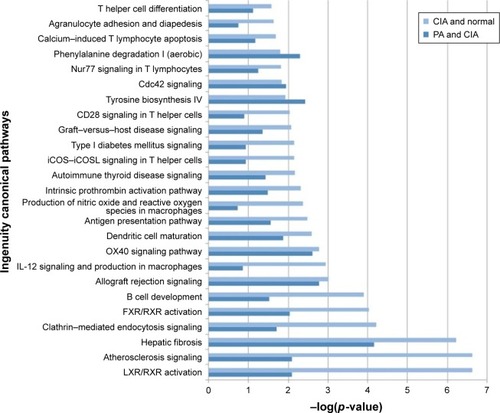
Table 2 Networks generated using ingenuity pathways analysis
Figure 5 Pathway networks were identified using ingenuity pathway analysis (IPA). Network #1 (A), network #2 (B), and network #3 (C) are shown. The node (protein) is described in the right of the figures. Colored nodes refer to proteins found in our dataset (green = upregulated, red = downregulated). Uncolored nodes were not identified as differentially expressed in our experiment and were integrated into the computationally generated IPA networks to indicate relevance to this network. Red circles indicate a significant effect by paeoniflorin (PA).
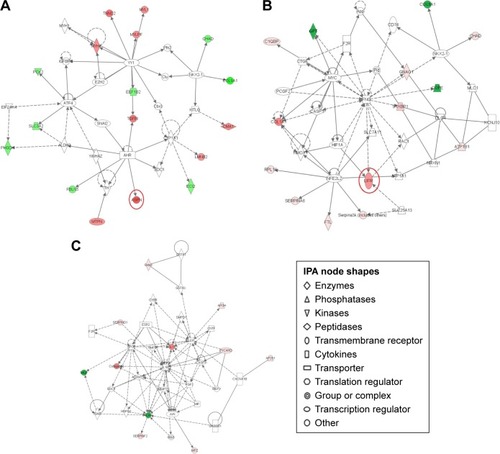
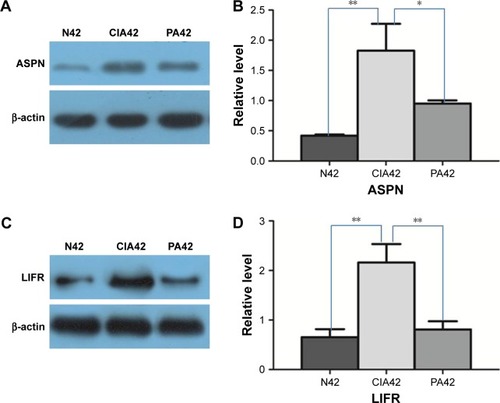
Figure 6 Result of Western blot verification: A and B show the expressional changes of asporin (ASPN) on day 42 of collagen-induced arthritis (CIA), normal (N) control and paeoniflorin (PA); C and D show the expressional changes of leukemia inhibitory factor receptor (LIFR) on day 42 of CIA, the normal control and PA.