Figures & data
Table 1 Antibodies for cardiac immature cells (including cardiac stem cells, cardiac progenitors, cardiac precursor cells, and amplifying cells)
Table 2 APS inhibited hyperglycemia and weight loss in diabetes
Table 3 APS protected heart function in diabetes
Figure 1 APS protect cardiac function in diabetes.
Note: Representative echocardiography images of hearts from diabetic or nondi-abetic SOD2+/− mice with or without APS treatment (n=6 per group).
Abbreviations: APS, astragalus polysaccharides; APS-DM, diabetic mice with APS treatment; APS-DM-SOD2+/−, diabetic SOD2+/− mice with APS treatment; Ctrl, C57BJ/6J mice were taken as the normal control; DM, diabetic mice; DM-SOD2+/−, diabetic SOD2+/− mice; SOD2+/−, nondiabetic SOD2+/− mice.
Abbreviations: APS, astragalus polysaccharides; APS-DM, diabetic mice with APS treatment; APS-DM-SOD2+/−, diabetic SOD2+/− mice with APS treatment; Ctrl, C57BJ/6J mice were taken as the normal control; DM, diabetic mice; DM-SOD2+/−, diabetic SOD2+/− mice; SOD2+/−, nondiabetic SOD2+/− mice.
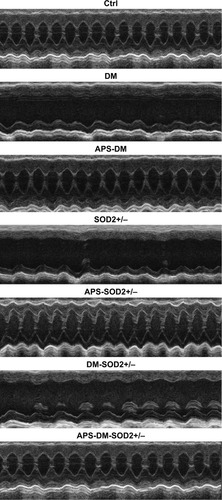
Figure 2 APS increased the abundance of CSPCs in diabetes.
Notes: Left ventricle was obtained from all mice after killing (n=6 per group). CSPCs were recognized by staining for the cell surface marker c-kit, and the c-kit-positive and lineage-negative cells were characterized and sorted by flow cytometry. (A) The number of CSPCs in left ventricle. Ventricular CSPCs were quantified utilizing the Schwartz–Saltykov methodology. Values are mean ± SEM. !P<0.05 vs diabetic mice, #P<0.05 vs SOD2+/− mice, ☨P<0.05 vs diabetic SOD2+/− mice, and *P<0.05 vs C57BJ/6J control mice. (B) Flow cytometry analysis for the identification of CSPCs. C-kit-positive and lineage-negative cells were gated from total population extracted from the left ventricle and the percentage of CSPC population was analyzed. (C) Confocal microscopy images showing c-kit-positive (blue) and lineage-negative CSPCs by IHC staining for the sections of left ventricle. (D) Confocal microscopy images showing c-kit-positive (blue) and lineage-negative CSPCs by IHC staining for the isolated ventricular CSPCs (original magnification: ×8 million).
Abbreviations: APS, astragalus polysaccharides; APS-DM, diabetic mice with APS treatment; APS-DM-SOD2+/−, diabetic SOD2+/− mice with APS treatment; Ctrl, C57BJ/6J mice were taken as the normal control; DM, diabetic mice; DM-SOD2+/−, diabetic SOD2+/− mice; IHC, immunohistochemistry; SOD2+/−, nondiabetic SOD2+/− mice.
Abbreviations: APS, astragalus polysaccharides; APS-DM, diabetic mice with APS treatment; APS-DM-SOD2+/−, diabetic SOD2+/− mice with APS treatment; Ctrl, C57BJ/6J mice were taken as the normal control; DM, diabetic mice; DM-SOD2+/−, diabetic SOD2+/− mice; IHC, immunohistochemistry; SOD2+/−, nondiabetic SOD2+/− mice.
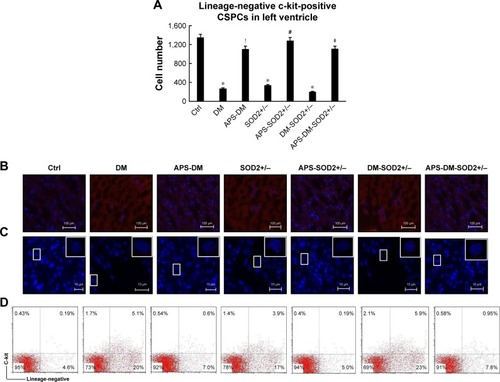
Figure 3 APS inhibited the apoptosis of CSPCs in diabetes.
Notes: Left ventricle was obtained from all mice after killing (n=6 per group). CSPCs were characterized and sorted by flow cytometry. Hairpin oligonucleotide probes were employed for the detection of cell apoptosis. (A) CSPC apoptosis in left ventricle detected by hairpin 1; Apoptotic CSPCs were quantified utilizing the Schwartz–Saltykov methodology. Values are mean ± SEM. !P<0.05 vs diabetic mice, #P<0.05 vs SOD2+/− mice, ☨P<0.05 vs diabetic SOD2+/− mice, and *P<0.05 vs C57BJ/6J control mice. (B) Flow cytometry analysis for the identification of CSPC apoptosis. Hairpin-1-positive cells were gated from total CSPC population extracted from the left ventricle and the percentage of apoptotic CSPC population was analyzed. (C) Confocal microscopy images showing hairpin 1-positive (red) CSPCs in left ventricle. CSPCs were recognized by c-kit labeling (blue) (original magnification: ×10 million).
Abbreviations: APS, astragalus polysaccharides; APS-DM, diabetic mice with APS treatment; APS-DM-SOD2+/−, diabetic SOD2+/− mice with APS treatment; CSPCs, cardiac stem and progenitor cells; Ctrl, C57BJ/6J mice were taken as the normal control; DM, diabetic mice; DM-SOD2+/−, diabetic SOD2+/− mice; SOD2+/−, nondiabetic SOD2+/− mice.
Abbreviations: APS, astragalus polysaccharides; APS-DM, diabetic mice with APS treatment; APS-DM-SOD2+/−, diabetic SOD2+/− mice with APS treatment; CSPCs, cardiac stem and progenitor cells; Ctrl, C57BJ/6J mice were taken as the normal control; DM, diabetic mice; DM-SOD2+/−, diabetic SOD2+/− mice; SOD2+/−, nondiabetic SOD2+/− mice.
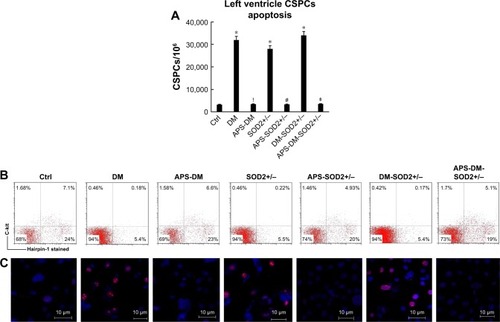
Figure 4 APS enhanced the proliferation of CSPCs in diabetes.
Notes: Left ventricle was obtained from all mice after killing (n=6 per group). CSPCs were characterized and sorted by flow cytometry. The expression of Ki67 was determined for the cell proliferation. (A) CSPC proliferation in left ventricle detected by Ki67. Proliferating CSPCs were quantified utilizing the Schwartz–Saltykov methodology. Values are mean ± SEM. !P<0.05 vs diabetic mice, #P<0.05 vs SOD2+/− mice, ☨P<0.05 vs diabetic SOD2+/− mice, and *P<0.05 vs C57BJ/6J control mice. (B) Flow cytometry analysis for the identification of CSPC proliferation. Ki67-positive cells were gated from total CSPC population extracted from the left ventricle and the percentage of proliferating CSPC population was analyzed. (C) Confocal microscopy images showing Ki67-positive (red) CSPCs in ventricle. CSPCs were recognized by c-kit labeling (blue) (original magnification: ×8 million).
Abbreviations: APS, astragalus polysaccharides; APS-DM, diabetic mice with APS treatment; APS-DM-SOD2+/−, diabetic SOD2+/− mice with APS treatment; CSPCs, cardiac stem and progenitor cells; Ctrl, C57BJ/6J mice were taken as the normal control; DM, diabetic mice; DM-SOD2+/−, diabetic SOD2+/− mice; SOD2+/−, nondiabetic SOD2+/− mice.
Abbreviations: APS, astragalus polysaccharides; APS-DM, diabetic mice with APS treatment; APS-DM-SOD2+/−, diabetic SOD2+/− mice with APS treatment; CSPCs, cardiac stem and progenitor cells; Ctrl, C57BJ/6J mice were taken as the normal control; DM, diabetic mice; DM-SOD2+/−, diabetic SOD2+/− mice; SOD2+/−, nondiabetic SOD2+/− mice.
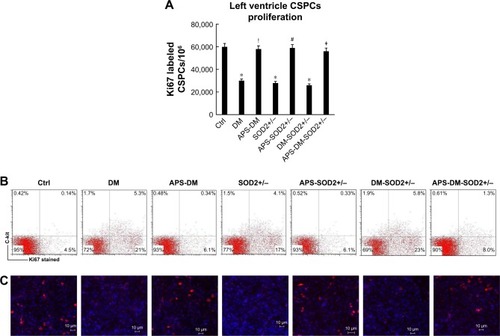
Figure 5 APS inhibited ROS formation and oxidative damage of CSPCs in diabetes.
Notes: Left ventricle was obtained from all mice after killing (n=6 per group). The c-kit-positive and lineage-negative cells were characterized and sorted by flow cytometry. CM-H2DCFDA was employed to measure the ROS formation, and the intracellular H2O2 and ⋅OH concentrations were analyzed utilizing InSpeak Microscopy Image Intensity Calibration microspheres and ImagePro analysis software. Nitrotyrosine and 8-OH-dG antibodies were employed to detect oxidative damage to cytoplasmic proteins and oxidative stress in the nuclei, respectively. (A) ROS formation in CSPCs in left ventricle. (B) Oxidative stress in the nuclei in CSPCs of left ventricle. (C) Oxidative damage to cytoplasmic proteins in CSPCs of left ventricle. Values are mean ± SEM. !P<0.05 vs diabetic mice, #P<0.05 vs SOD2+/− mice, ☨P<0.05 vs diabetic SOD2+/− mice, and *P<0.05 vs C57BJ/6J control mice.
Abbreviations: APS, astragalus polysaccharides; APS-DM, diabetic mice with APS treatment; APS-DM-SOD2+/−, diabetic SOD2+/− mice with APS treatment; CM-H2DCFDA, 5-(6)-chloromethyl-2′,7′-dichlorodihydrofluorescein diacetate; CSPCs, cardiac stem and progenitor cells; Ctrl, C57BJ/6J mice were taken as the normal control; DM, diabetic mice; DM-SOD2+/−, diabetic SOD2+/− mice; H2O2, hydrogen peroxide; ⋅OH, hydroxyl radicals; ROS, reactive oxygen species; SOD2+/−, nondiabetic SOD2+/− mice.
Abbreviations: APS, astragalus polysaccharides; APS-DM, diabetic mice with APS treatment; APS-DM-SOD2+/−, diabetic SOD2+/− mice with APS treatment; CM-H2DCFDA, 5-(6)-chloromethyl-2′,7′-dichlorodihydrofluorescein diacetate; CSPCs, cardiac stem and progenitor cells; Ctrl, C57BJ/6J mice were taken as the normal control; DM, diabetic mice; DM-SOD2+/−, diabetic SOD2+/− mice; H2O2, hydrogen peroxide; ⋅OH, hydroxyl radicals; ROS, reactive oxygen species; SOD2+/−, nondiabetic SOD2+/− mice.
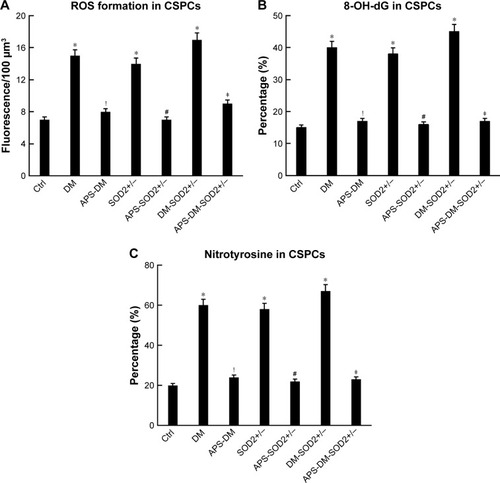
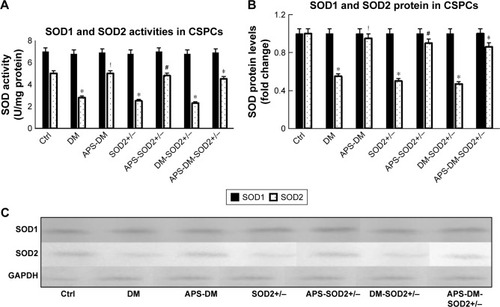
Figure 6 APS enhanced SOD2 enzyme activities and protein levels of CSPCs in diabetes.
Notes: Left ventricle was obtained from all mice after killing (n=6 per group). The c-kit-positive and lineage-negative cells were characterized and sorted by flow cytometry. SOD activity was measured by the extent of reduction in the appearance of nitroblue tetrazolium-diformazan utilizing the Superoxide Dismutase Assay Kit. Total SOD and SOD2 activities in U/mg protein were calculated, and SOD1 activity was determined by subtracting the SOD2 activity from the total SOD activity. SOD protein levels were analyzed by Western blotting. Membranes were stripped and reprobed for glyceraldehyde 3-phosphate dehydrogenase as a loading control. Protein content was measured and normalized as a ratio relative to the normal control. (A) SOD1 and SOD2 enzyme activities in CSPCs. (B) Protein levels of SOD1 and SOD2 in CSPCs. (C) Representative autoradiographs of Western blots. Values are mean ± SEM. !P<0.05 vs diabetic mice, #P<0.05 vs SOD2+/− mice, ☨P<0.05 vs diabetic SOD2+/− mice, and *P<0.05 vs C57BJ/6J control mice.
Abbreviations: APS, astragalus polysaccharides; APS-DM, diabetic mice with APS treatment; APS-DM-SOD2+/−, diabetic SOD2+/− mice with APS treatment; CSPCs, cardiac stem and progenitor cells; Ctrl, C57BJ/6J mice were taken as the normal control; DM, diabetic mice; DM-SOD2+/−, diabetic SOD2+/− mice; SOD2+/−, nondiabetic SOD2+/− mice.
Abbreviations: APS, astragalus polysaccharides; APS-DM, diabetic mice with APS treatment; APS-DM-SOD2+/−, diabetic SOD2+/− mice with APS treatment; CSPCs, cardiac stem and progenitor cells; Ctrl, C57BJ/6J mice were taken as the normal control; DM, diabetic mice; DM-SOD2+/−, diabetic SOD2+/− mice; SOD2+/−, nondiabetic SOD2+/− mice.