Figures & data
Table 1 Classification of DR severity
Figure 1 The main mechanisms of hyperglycemia-induced damage considered responsible for the occurrence of diabetic retinopathy: increased polyol pathway flux, increased AGEs formation, increased hexosamine pathway flux, and activation of PKC.
Abbreviations: AGEs, advanced glycation end-products; PKC, protein kinase C; ROS, reactive oxygen species.
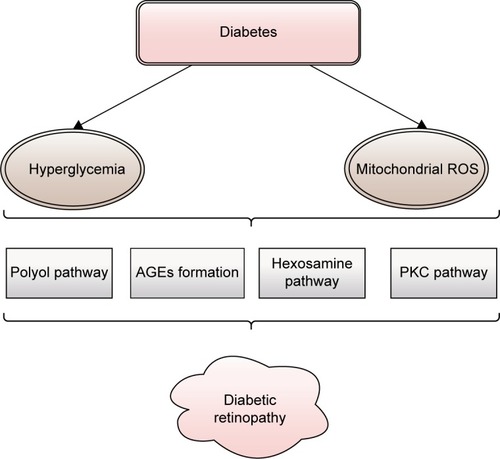
Figure 2 Schematic presentation of stages of polyol pathway: (I) glucose reduction to sorbitol by AR (using NADPH as a cofactor) followed by (II) sorbitol oxidation to fructose by SDH (using NAD+ as a cofactor).
Abbreviations: AR, aldose reductase; NAD+, nicotinamide adenine dinucleotide – oxidized; NADH, nicotinamide adenine dinucleotide – reduced; NADP+, nicotinamide adenine dinucleotide phosphate – oxidized; NADPH, nicotinamide adenine dinucleotide phosphate – reduced; SDH, sorbitol dehydrogenase.
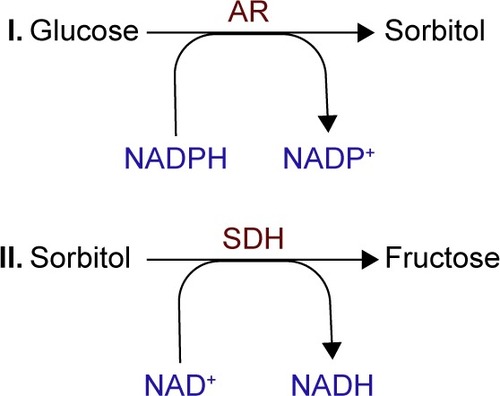
Figure 3 Polyol pathway changes induced in NADH (NADPH)/NAD+ (NADP+) ratios with the decrease of GR, leading to ROS accumulation and tissue impairments.
Abbreviations: GR, glutathione reductase; NAD+, nicotinamide adenine dinucleotide – oxidized; NADH, nicotinamide adenine dinucleotide – reduced; NADP+, nicotinamide adenine dinucleotide phosphate – oxidized; NADPH, nicotin-amide adenine dinucleotide phosphate – reduced; ROS, reactive oxygen species.
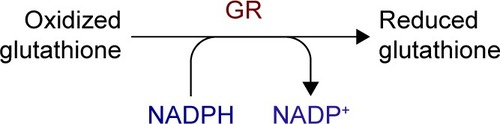
Figure 4 Schematic presentation of AGEs formation and the pathways through which AGEs target cells: altered function of intracellular proteins; abnormal interaction between matrix components and protein receptors (integrins); increased production of ROS due to abnormal interaction between plasma proteins and specific AGE receptors.
Abbreviations: AGEs, advanced glycation end-products; ROS, reactive oxygen species.
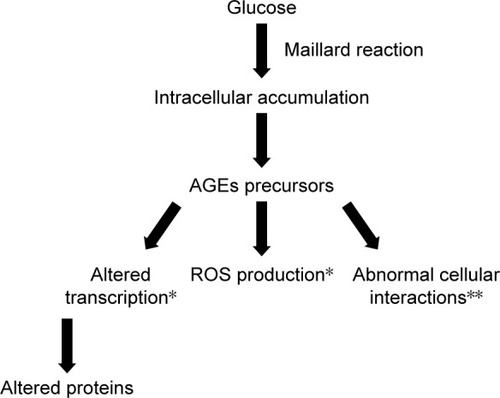
Figure 5 Schematic presentation of the contribution of increased hexosamine pathway flux in pathogenesis of DR.
Abbreviations: DR, diabetic retinopathy; F-6-P, fructose-6-phosphate; G-6-P, glucose-6-phosphate; GFAT, glutamine–fructose-6-phosphate aminotransferase; GlcN-6P, N-acetylglucosamine-6-phosphate; PAI-1, plasminogen activator inhibitor-1; TGF-α, transforming growth factor-alpha; TGF-β1, transforming growth factor-beta 1.
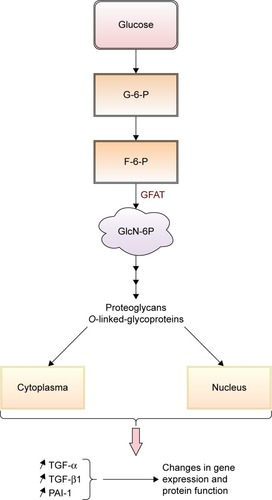
Figure 6 Schematic presentation of the contribution of PKC activation to the development of diabetic retinopathy.
Abbreviations: DAG, diacylglycerol; MAPK, mitogen-activated protein kinase; NO, nitric oxide; PKC, protein kinase C; VEGF, vascular endothelial growth factors.
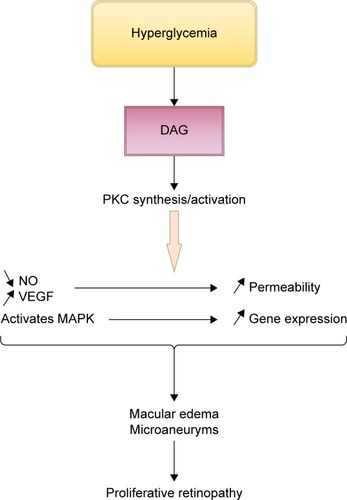
Table 2 Proteins secreted from RPE cells
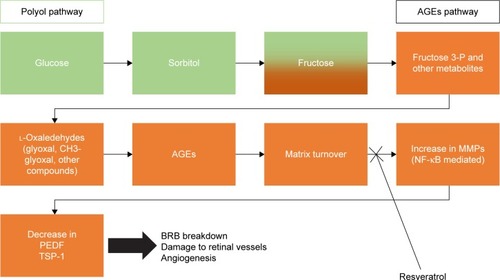
Figure 7 Schematic presentation of a possible mechanism of action for resveratrol in the development of diabetic retinopathy.