
Figures & data
Table 1 Factorial designs for the preparation of transethosomes
Table 2 Composition of the gel base
Table 3 Experimental design and value of each factor and responses for transethosomes with Tween 20® (TET) design
Table 4 Experimental design and value of each factor and responses for transethosomes with sodium taurocholate (TENa) design
Table 5 Experimental design and value of each factor and responses for transethosomes with Labrafil® (TEL) design
Table 6 Results of regression analysis for the responses of the size, Đ, and ZP for all the designs
Table 7 Coded equations of the size, Đ, and ZP for all the designs
Figure 1 Response surface plots showing influences of the independent factors on the response parameters in TET design.
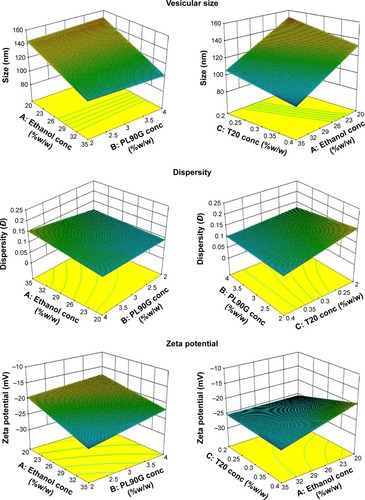
Figure 2 Response surface plots showing influences of the independent factors on the response parameters in TENa design.
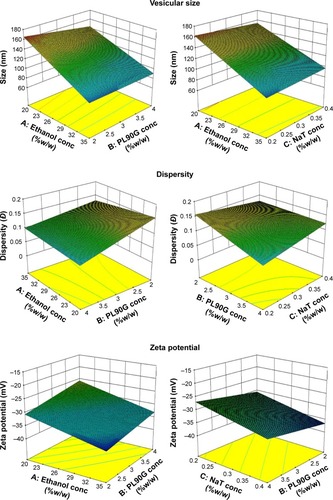
Figure 3 Response surface plots showing influences of the independent factors on the response parameters in TEL design.
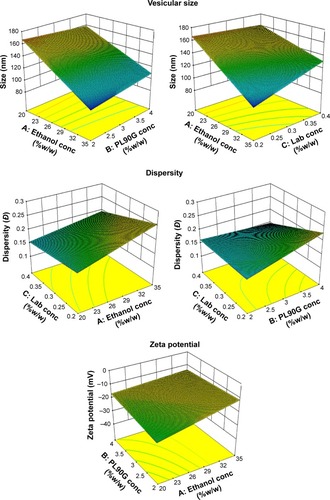
Table 8 The effect (increase/decrease) of individual factors on the vesicular size, Đ, and ZP in each design
Table 9 Characteristics of transethosomes loaded with 0.2%w/w of colchicine
Table 10 Characteristics of transethosomes loaded with 0.3%w/w of colchicine
Table 11 Characteristics of transethosomes loaded with 0.5%w/w of colchicine
Table 12 Characterization of various colchicine-loaded transethosomal gels
Figure 4 Representative rheograms of the prepared transethosomal gels.
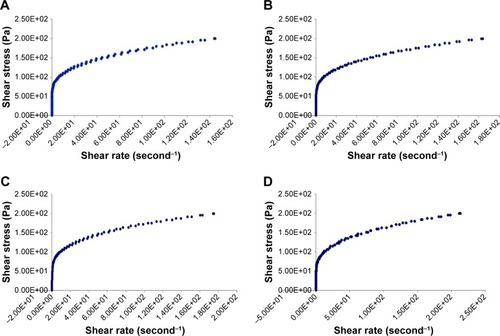
Figure 5 Ex vivo skin permeation of colchicine from various gels.
Abbreviations: NE, non–ethosomal; TET, transethosomes with Tween 20®; TENa, transethosomes with sodium taurocholate.
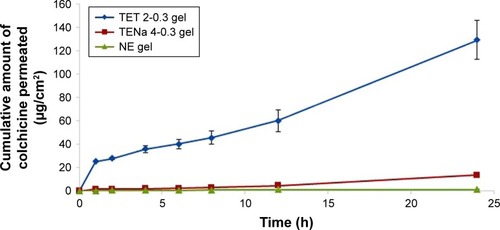
Table 13 The flux at steady state (Jss) and the permeability coefficient (Kp) of colchicine from various gels through rat skin
Figure 6 TEM images of TET 2-0.3 transethosomes in its suspension and transethosomal gel forms.
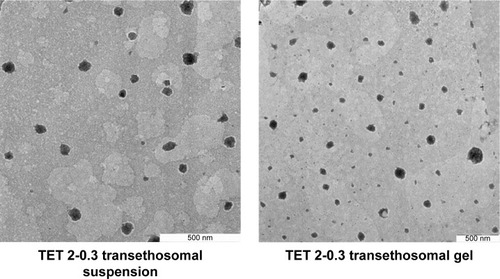
Table 14 Stability study results of the TET 2-0.3 gel stored at 4°C±2°C
Table 15 Stability study results of the TET 2-0.3 gel stored at 25°C±2°C/60%±5% RH