
Figures & data
Table 1 Effect of tanshinol on body weight, liver weight and liver index of rats (mean±SD)
Table 2 Effect of tanshinol on serum concentrations of ALT, AST, and TBIL
Table 3 Effect of tanshinol on serum concentrations of HA, LN, IV-C, and PIIIP
Figure 1 Effect of tanshinol on the morphology and architecture of the liver.
Notes: (A) H&E staining. Magnification ×100. (B) Masson’s trichrome staining. Magnification ×100. (C) the scores of liver fibrosis degree. (D) The area of collagen fibers in liver (100%). ap<0.05, compared with the control group, bp<0.05, compared with the model group, cp<0.05, compared with the tanshinol 20 mg/kg group. The different mark represents liver fibrosis degree score of each rat in different group.
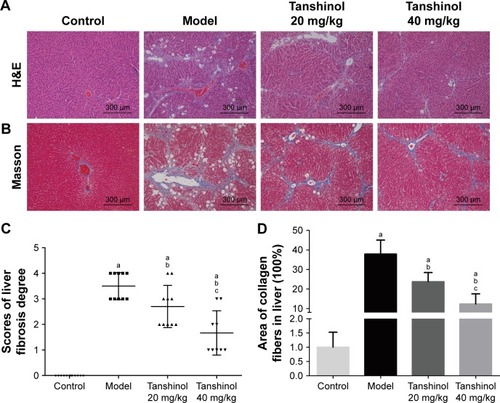
Figure 2 Effect of tanshinol on expression level of (A) SOD, (B) GSH-Px, and (C) MDA in CCl4-induced liver tissues.
Notes: ap<0.05, compared with the control group; bp<0.05, compared with the model group; cp<0.05, compared with the tanshinol 20 mg/kg group.
Abbreviations: CCl4, carbon tetrachloride; GSH-Px, glutathione peroxidase; MDA, malondialdehyde; SOD, superoxide dismutase.
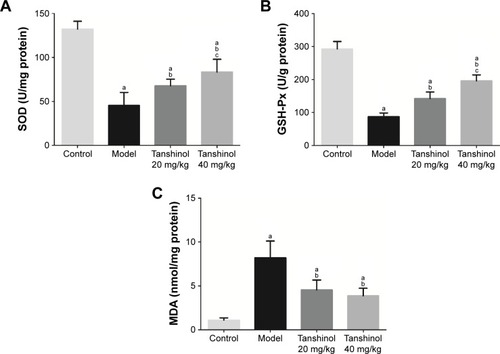
Figure 3 Effect of tanshinol on inflammatory factors (TGF-β, TNF-α, Cox-2, IL-1β, and IL-6) in CCl4-induced liver tissues.
Notes: ap<0.05, compared with the control group; bp<0.05, compared with the model group; cp<0.05, compared with the tanshinol 20 mg/kg group.
Abbreviations: Cox-2, cyclooxygenase-2; IL, interleukin; TNF-α, tumor necrosis factor-α; TGF-β, transforming growth factor-β.
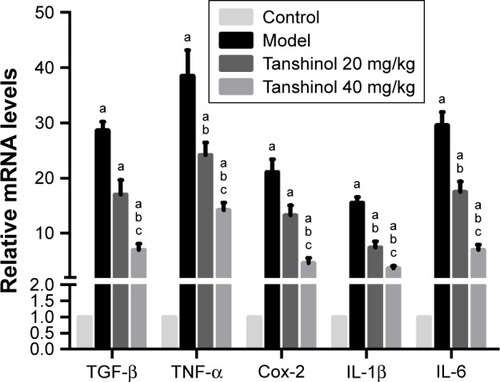
Figure 4 Effect of tanshinol on the expression of NF-κB signaling pathway.
Abbreviations: IκBα, inhibitor of kappa B; NF-κB, nuclear factor kappa B.
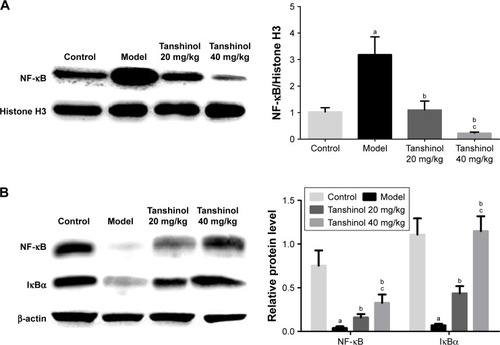
Figure 5 Effect of tanshinol on expression of Nrf2 in cell nucleus (A) and cytoplasm (B) in CCl4-induced liver tissues.
Notes: ap<0.05, compared with the control group; bp<0.05, compared with the model group; cp<0.05, compared with the tanshinol 20 mg/kg group.
Abbreviations: CCl4, carbon tetrachloride; Nrf2, nuclear factor erythroid2-related factor 2.
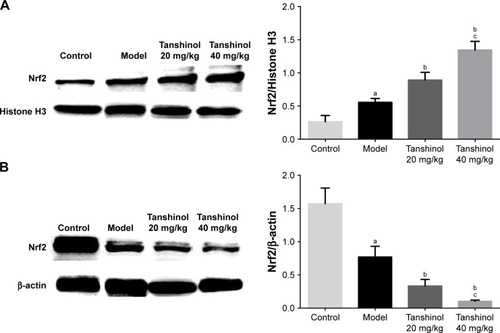
Figure 6 Effect of tanshinol on expression of HO-1, NQO-1 and GCLC in CCl4-induced liver tissues.
Abbreviations: CCl4, carbon tetrachloride; GCLC, glutamate-cysteine ligase; HO-1, hemeoxygenase-a; NQO-1, quinine oxidoreductase-1.
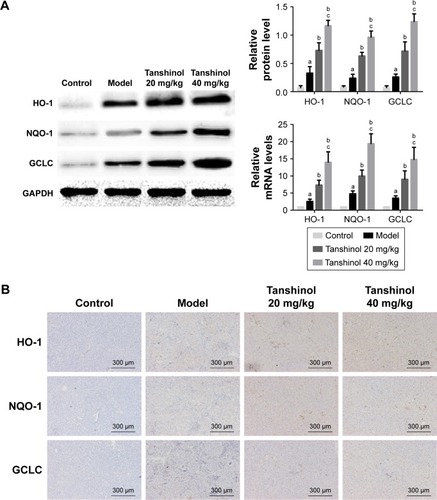
Table S1 Primer sequences for real-time polymerase chain reaction assay