Figures & data
Figure 1 A schematic representation of the experimental protocol.
Abbreviations: I/R, ischemia–reperfusion; KHB, Krebs–Henseleit buffer; PIGF, placental growth factor; SPC, sevoflurane preconditioning.
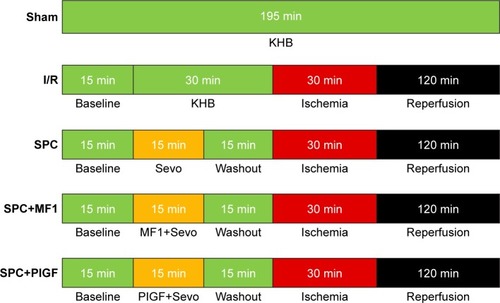
Table 1 The basal hemodynamics of isolated hearts
Figure 2 Pretreatment with 2.5% sevoflurane improved the cardiac LV function after I/R injury.
Notes: (A–D) The LV function parameters including LVDP, ±dp/dt, and LVEDP during reperfusion (n=12). Values are presented as mean ± SEM. **P<0.01 vs the sham group; ‡P<0.01 vs the I/R group; ##P<0.01 vs the SPC group.
Abbreviations: +dp/dt, maximum LVDP increase rate; −dp/dt, maximum LVDP decrease rate; I/R, ischemia–reperfusion; LV, left ventricle; LVDP, left ventricular developed pressure; LVEDP, left ventricular end-diastolic pressure; PIGF, placental growth factor; SEM, standard error of the mean; SPC, sevoflurane preconditioning.
Abbreviations: +dp/dt, maximum LVDP increase rate; −dp/dt, maximum LVDP decrease rate; I/R, ischemia–reperfusion; LV, left ventricle; LVDP, left ventricular developed pressure; LVEDP, left ventricular end-diastolic pressure; PIGF, placental growth factor; SEM, standard error of the mean; SPC, sevoflurane preconditioning.
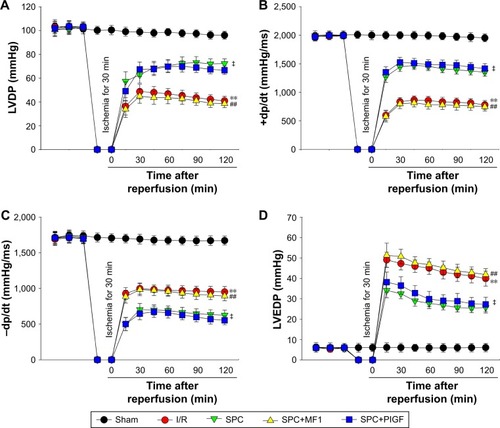
Figure 3 Pretreatment with 2.5% sevoflurane limits the myocardial infarct size and reduces cardiac enzyme release.
Notes: (A) Representative myocardial cross sections of TTC-stained hearts for the five groups (n=6, five slices per heart). Red-stained areas indicate viable tissue, and unstained pale areas indicate infarct tissue. (B) Myocardial infarct size of hearts in the five groups. (C–E) Total CK-MB, LDH, and cTnI release in coronary effluent after 2 h reperfusion. Values are expressed as mean ± SEM. **P<0.01 vs the sham group; ‡P<0.01 vs the I/R group; ##P<0.01 vs the SPC group.
Abbreviations: CK-MB, creatine kinase-MB, cTnI, cardiac troponin-I; I/R, ischemia–reperfusion; LDH, lactate dehydrogenase; PIGF, placental growth factor; SEM, standard error of the mean; SPC, sevoflurane preconditioning; TTC, triphenyl tetrazolium chloride.
Abbreviations: CK-MB, creatine kinase-MB, cTnI, cardiac troponin-I; I/R, ischemia–reperfusion; LDH, lactate dehydrogenase; PIGF, placental growth factor; SEM, standard error of the mean; SPC, sevoflurane preconditioning; TTC, triphenyl tetrazolium chloride.
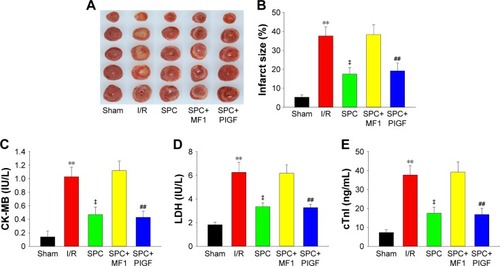
Figure 4 Representative immunoblots (top panel) of VEGFR-1 in isolated rat hearts. Values are presented as mean ± SEM.
Notes: **P<0.01 vs the I/R group; ##P<0.01 vs the SPC group.
Abbreviations: I/R, ischemia–reperfusion; PIGF, placental growth factor; SEM, standard error of the mean; SPC, sevoflurane preconditioning; VEGFR-1, vascular endothelial growth factor receptor 1.
Abbreviations: I/R, ischemia–reperfusion; PIGF, placental growth factor; SEM, standard error of the mean; SPC, sevoflurane preconditioning; VEGFR-1, vascular endothelial growth factor receptor 1.
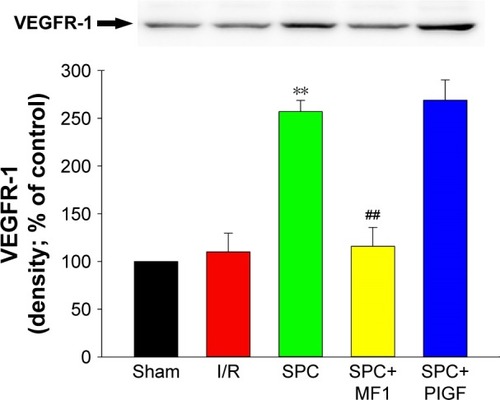
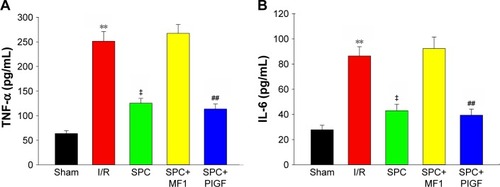
Figure 5 Pretreatment with 2.5% sevoflurane attenuates the inflammatory cytokine release after I/R.
Notes: (A) The release of TNF-α after 2 h reperfusion. (B) The release of IL-6 after 2 h reperfusion. Values are presented as mean ± SEM. **P<0.01 vs the sham group; ‡P<0.01 vs the I/R group; ##P<0.01 vs the SPC group.
Abbreviations: IL-6, interleukin 6; I/R, ischemia–reperfusion; PIGF, placental growth factor; SEM, standard error of the mean; SPC, sevoflurane preconditioning; TNF-α, tumor necrosis factor-alpha.
Abbreviations: IL-6, interleukin 6; I/R, ischemia–reperfusion; PIGF, placental growth factor; SEM, standard error of the mean; SPC, sevoflurane preconditioning; TNF-α, tumor necrosis factor-alpha.