Figures & data
Figure 1 The anti-CEA-IL15, Fc-IL15, and anti-CEA-Fc fusion proteins.
Notes: (A) Schematic representation of anti-CEA-IL15, Fc-IL15, and anti-CEA-Fc. SP, IL-2 signal peptide; Fc, CH2 and CH3 of human IgG1; IL15Rα, the sushi domain of IL15Rα including the subsequent 12 amino acids from exon 3. (B) Coomassie blue staining of anti-CEA-IL15, Fc-IL15, and anti-CEA-Fc. Purified protein was run on 10% SDS-PAGE followed by staining with Coomassie blue solution. (C) Mo7e proliferation stimulated by anti-CEA-IL15 and Fc-IL15. (D) CTLL-2 proliferation stimulated by anti-CEA-IL15 and Fc-IL15. Results were the averages of duplicate from the representative of three independent experiments, error bars represent the SD.
Abbreviations: CEA, carcinoembryonic antigen; Fc (IgG1), fragment crystallizable (immunoglobulin G1); IL, interleukin; MW, molecular weight; OD, optical density; SP, signal peptide; SDS-PAGE, sodium dodecyl sulfate-polyacrylamide gel electrophoresis.
Abbreviations: CEA, carcinoembryonic antigen; Fc (IgG1), fragment crystallizable (immunoglobulin G1); IL, interleukin; MW, molecular weight; OD, optical density; SP, signal peptide; SDS-PAGE, sodium dodecyl sulfate-polyacrylamide gel electrophoresis.
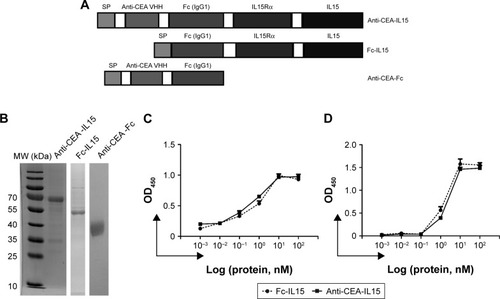
Figure 2 Anti-CEA-IL15 binds to CEA antigen.
Notes: Flow cytometry analysis of anti-CEA-IL15 binding (A) to CEA-positive cell lines LS174T and HT29, as well as CEA-negative cell lines SKOV3 and CHO. Dashed line, control; solid line, anti-CEA-IL15. (B) Anti-CEA-IL15 co-localization with CEA in CEA-positive LS174T cell line and CEA-negative SKOV3 cell line using confocal microcopy. DAPI, DAPI staining of nucleus; anti-CEA-IL15, cells stained with anti-CEA-IL15, then incubated with Alex488-conjugated anti-human IgG1; Merge, the combination of DAPI staining, anti-CEA-IL15 staining, and phase contrast images.
Abbreviations: CEA, carcinoembryonic antigen; DAPI, 4′,6-diamidino-2-phenylindole; IL-15, interleukin-15.
Abbreviations: CEA, carcinoembryonic antigen; DAPI, 4′,6-diamidino-2-phenylindole; IL-15, interleukin-15.
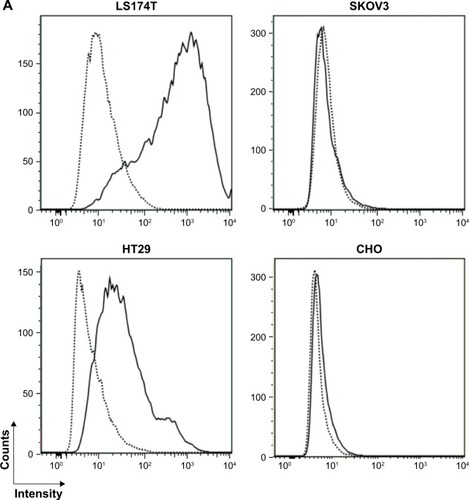
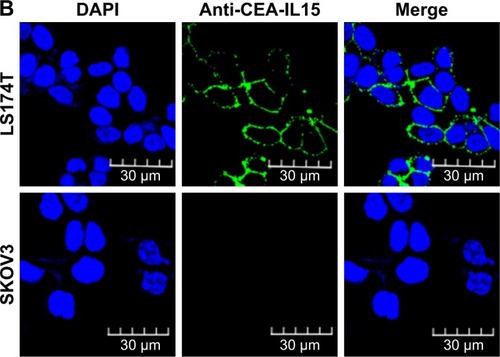
Figure 3 Anti-CEA-IL15 mediates potent cytotoxic activity against CEA-positive tumor cells.
Notes: Freshly isolated human PBMC or NK cells were used as effector cells. CEA-positive LS174T (A) or CEA-negative SKOV3 (B) cell lines were used as target cells (effector cells/target cells ratio=10:1) in the presence of 1 or 10 μg/mL of anti-CEA-IL15, control Fc-IL15, or anti-CEA-Fc. Viable cells were measured after culturing for 3 days. Survival rates were calculated as described in the “Materials and methods” section. Figures were plotted using Prism5. All data are the mean of triplicates, with error bars representing the SD (*p<0.05, **p<0.01, ***p<0.001, independent t-test, PBMC/NK only vs PBMC/NK plus treatment groups).
Abbreviations: CEA, carcinoembryonic antigen; IL-15, interleukin-15; NK, natural killer; PBMC, peripheral blood mononuclear cell.
Abbreviations: CEA, carcinoembryonic antigen; IL-15, interleukin-15; NK, natural killer; PBMC, peripheral blood mononuclear cell.
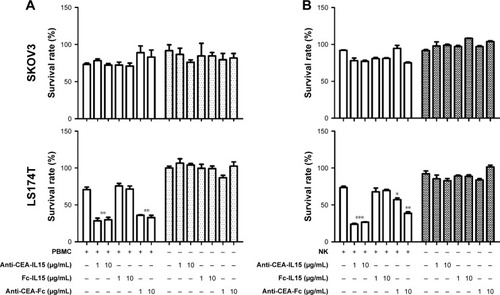
Figure 4 Anti-CEA-IL15 inhibits tumor growth in vivo.
Notes: (A) NOD/SCID mice (n=6 per group) were engrafted subcutaneously with a mixture of LS174T cells (1×10⁶) and fresh isolated human PBMCs (5×10⁶). Mice were then administered with PBS or anti-CEA-IL15 intraperitoneally (5 or 25 μg per animal) every 3 days. Tumor volumes of different treatment groups were measured (data are shown as the mean±SEM; n=6; *p<0.05, two-way ANOVA, vehicle vs treatment groups). (B) C57bl/6 mice (n=6 per group) were engrafted subcutaneously with MC38 cells (1×10⁶). Mice were then administered with PBS or different amounts of anti-CEA-IL15 intraperitoneally every 3 days. Tumor volumes of different treatment groups were measured (data are shown as the mean±SEM; n=6; *p<0.05, two-way ANOVA, vehicle vs treatment groups). (C) The body weight of animals in different treatment groups during the administration. The data shown are the mean, with error bars representing the SD. (D) White blood cell counts of different treatment groups. Data represent the average tumor volume of six mice. Error bars represent the SD (*p<0.05, two-way ANOVA, vehicle vs treatment groups).
Abbreviations: ANOVA, analysis of variance; CEA, carcinoembryonic antigen; IL-15, interleukin-15; NOD/SCID, nonobese diabetic-severe combined immunodeficiency disease; PBMC, peripheral blood mononuclear cell; SEM, standard error of the mean.
Abbreviations: ANOVA, analysis of variance; CEA, carcinoembryonic antigen; IL-15, interleukin-15; NOD/SCID, nonobese diabetic-severe combined immunodeficiency disease; PBMC, peripheral blood mononuclear cell; SEM, standard error of the mean.
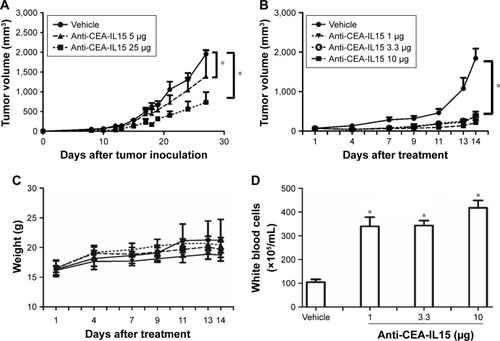
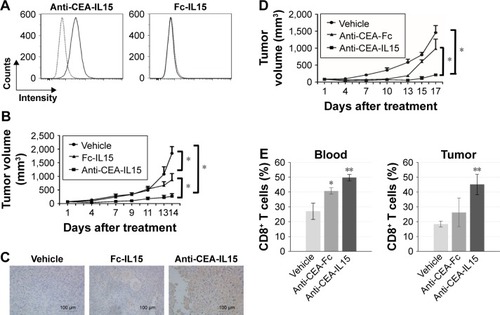
Figure 5 Anti-CEA-IL15 targets the tumor microenvironment and enhances the antitumor functions of IL-15.
Notes: (A) Flow cytometry analysis of anti-CEA-IL15 binding to MC38-CEA cells. (B) C57bl/6 mice (n=6 per group) were engrafted subcutaneously with MC38-CEA cells (1×10⁶), and then, were administered with PBS, Fc-IL15 (8 μg per animal), or anti-CEA-IL15 (10 μg per animal) intraperitoneally every 3 days. Tumor volumes of different treatment groups were measured (data are shown as the mean±SEM; n=6; *p<0.05, two-way ANOVA, vehicle vs treatment groups, anti-CEA-IL15 vs Fc-IL15). (C) Immunohistochemical staining of tumor tissue sections from different treatment groups. (D) C57bl/6 mice (n=6 per group) were engrafted subcutaneously with MC38-CEA cells (1×10⁶), followed by administration of PBS, anti-CEA-Fc (6 μg per animal), or anti-CEA-IL15 (10 μg per animal) intraperitoneally every 3 days. Tumor volume of different treatment groups were measured (data are shown as the mean±SEM; n=6; *p<0.05, two-way ANOVA, vehicle vs treatment groups). (E) Flow cytometry analysis of lymphocytes isolated from peripheral blood and tumor of mice treated with vehicle, anti-CEA-Fc, or anti-CEA-IL15. Percentages of CD8+ T cells in blood (left) and tumor (right) are displayed (data are shown as the mean±SEM; n=3; *p<0.05, **p<0.01, independent t-test, vehicle vs anti-CEA-Fc or anti-CEA-IL15).
Abbreviations: ANOVA, analysis of variance; CEA, carcinoembryonic antigen; IL-15, interleukin-15; SEM, standard error of the mean.
Abbreviations: ANOVA, analysis of variance; CEA, carcinoembryonic antigen; IL-15, interleukin-15; SEM, standard error of the mean.