
Figures & data
Table 1 Composition and precompression evaluation of HHC sublingual tablet mixtures
Figure 1 DSC thermograms of HHC and its physical mixtures with (A) Avicel, (B) d-Mannitol, and (C) SSG.
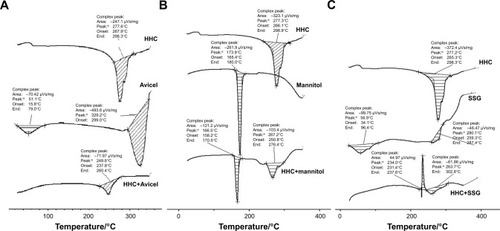
Figure 2 DSC thermograms of HHC and its physical mixtures with (A) Pharmaburst, (B) talc, and (C) saccharin sodium.
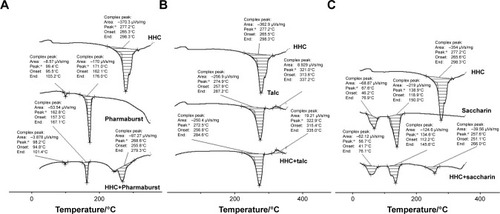
Figure 3 FTIR spectra of HHC and its physical mixtures with (A) Avicel, (B) d-Mannitol, and (C) SSG.
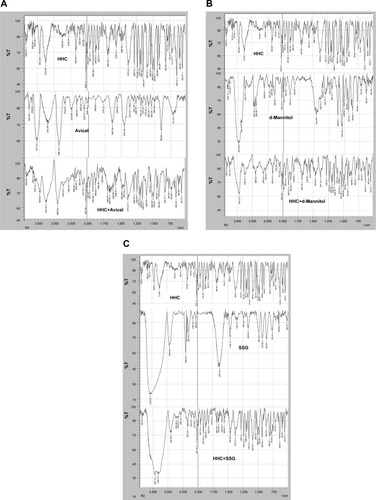
Figure 4 FTIR spectra of HHC and its physical mixtures with (A) Pharmaburst, (B) talc, and (C) saccharin sodium.
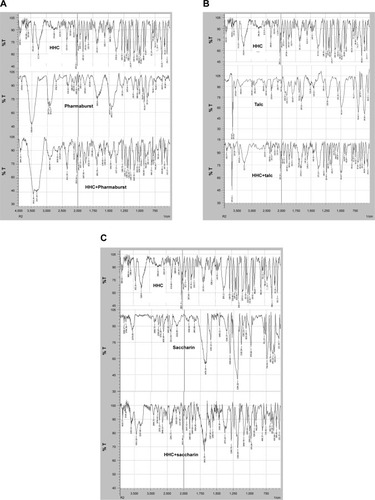
Table 2 Characterization of the prepared HHC sublingual tablets
Figure 5 Dissolution profiles of HHC from sublingual tablets prepared using (A) SSG and (B) Pharmaburst in comparison to plain drug.
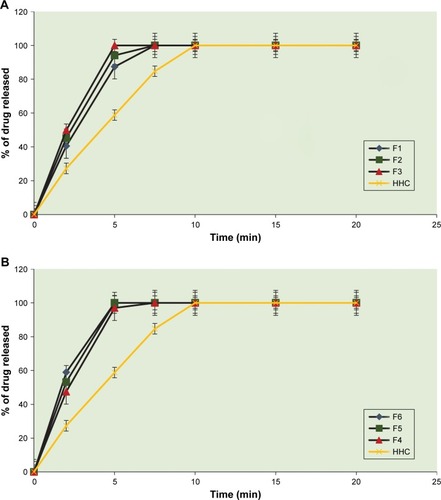
Figure 6 Mean plasma concentration–time curves of the prepared HHC sublingual tablet formula (F6) in comparison to conventional HHC oral tablets in rabbits.
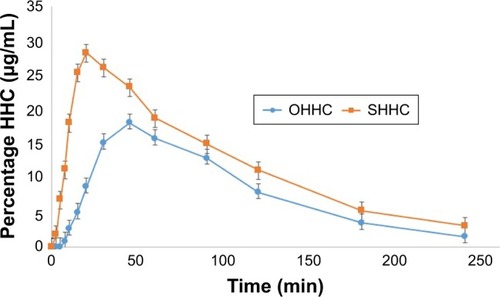
Table 3 The mean pharmacokinetic parameters of HHC after administration to rabbits by oral and sublingual routes
Table 4 CIs of the statistically calculated mean differences of calculated pharmacokinetic parameters
Figure 7 Bar chart of (A) BP of pregnant rats before and after treatment with l-NAME in comparison to non-pregnant rats. (B) The effect of HHC in different dosage forms on BP of pregnant rats.
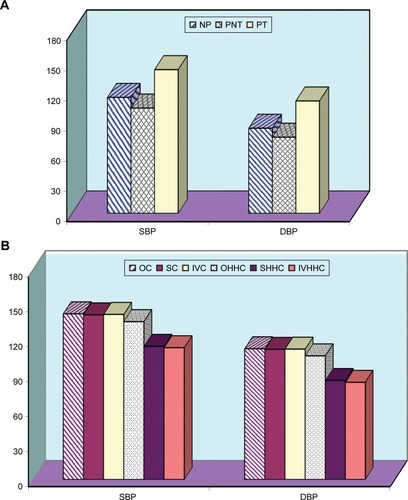
Table 5 One-way ANOVA test for systolic blood pressure data
Table 6 One-way ANOVA test for diastolic blood pressure data