Figures & data
Figure 1 Photograph showing particles stuck to the spray-drying chamber.
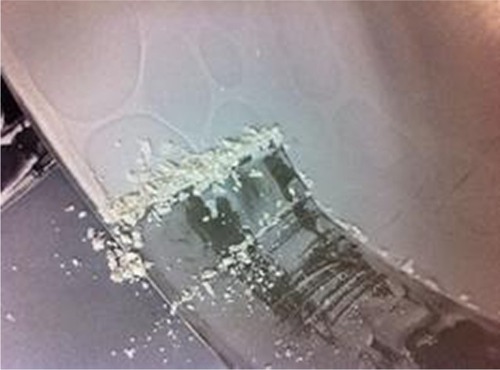
Figure 2 Electron microscopy showing surface morphology of spray-dried particles.
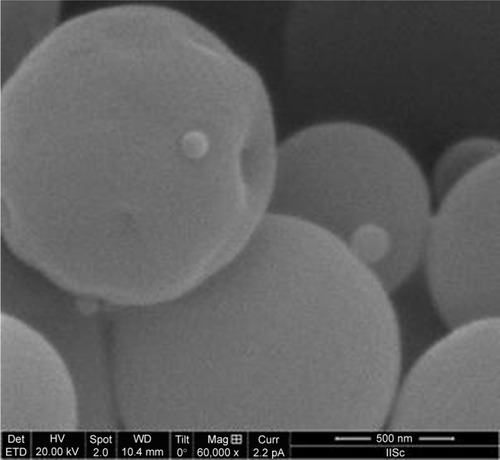
Figure 3 Graph showing particle diameter vs % volume of sample of our powder formulation.
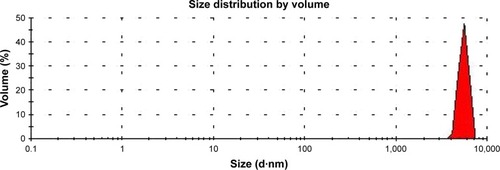
Figure 4 Response Surface Analysis.
Abbreviation: PS, particle size.
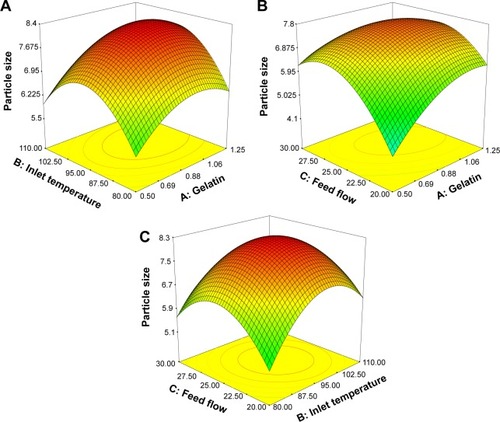
Table 1 Experimental data/runs showing the response (PS) for different values of the independent variables
Table 2 Coefficients of the statistical model fitted to the experimental data
Table 3 ANOVA of coefficients of the quadratic model fitted to the data
Table 4 Optimization of PS using CCRD
Figure 5 In vitro drug release curves for both formulation and pure drug.
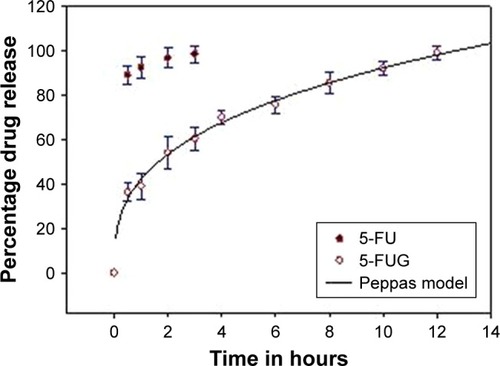
Figure 6 Shape of the microspheres after in vitro release studies.
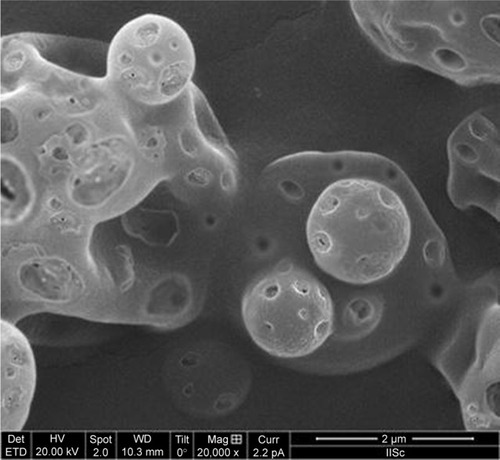
Figure 7 Plasma concentration profile showing 5-FU (□) and 5-FUG (◊) release.
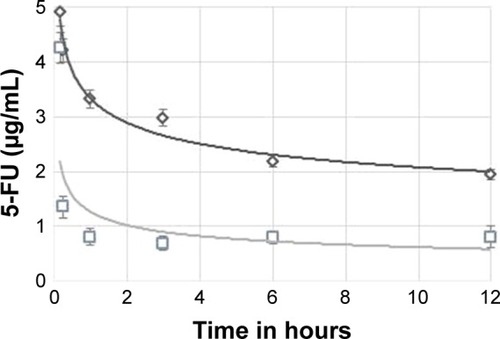
Figure 8 Biodistribution of 5-FU formulation in different organs.
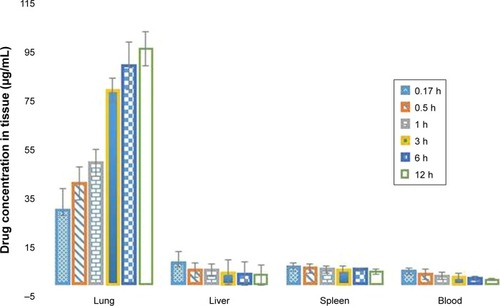
Table 5 Plasma concentration of 5-FUG and 5-FU injection after iv administration
Figure 9 Histology of lung tissue.
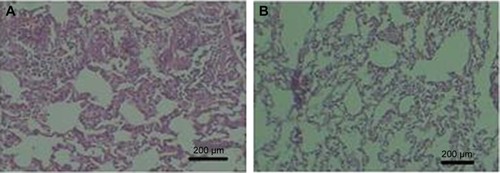
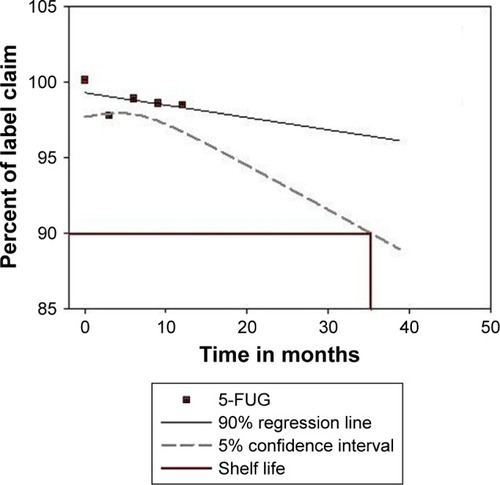
Figure 10 Shelf-life of 5-FUG formulation.