Figures & data
Figure 1 The synthesis pathway of MTX-Gd.
Abbreviations: DMF, N,N-dimethylformamide; DOTA, 1,4,7,10-tetraazacyclododecane-1,4,7,10-tetraacetic acid; MTX, methotrexate; EDC, 1-ethyl-3-(3-dimethylamino-propyl)carbodiimide hydrochloride; NHS, N-hydroxysuccinimide; Gd, gadolinium(III); Gd(AC)3, Gd(CH3COOH)3.
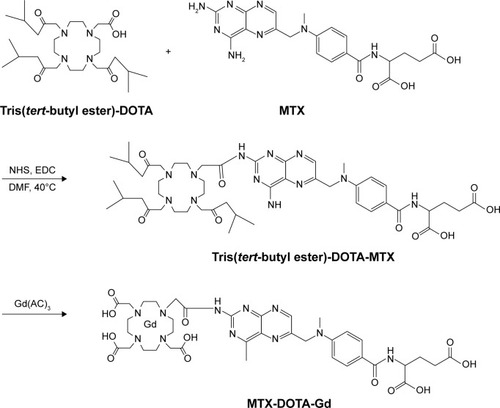
Figure 2 (A) UV–visible–NIR absorbance spectra of MTX-Gd. (B) FTIR spectra of MTX-Gd.
Abbreviations: FTIR, Fourier-transform infrared; MTX, methotrexate; NIR, near infrared; UV, ultraviolet; Gd, gadolinium(III).
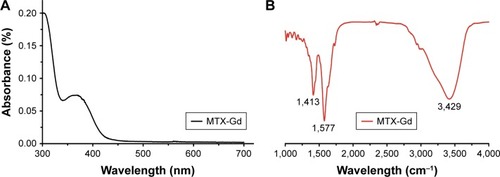
Figure 3 After treating the cells with various concentrations of complexes for 48 hours, the cytotoxic effects of MTX-Gd and MTX were detected using the MTT assay.
Notes: Data represent the average of two independent experiments. (A) The curve indicates the cell viability of different concentrations of MTX-Gd or MTX. (B) Histogram indicates the cell viability of different concentrations of MTX-Gd or MTX. *P<0.05, for all comparisons, indicates a difference in cell viability. **P>0.05, for all comparisons, indicates no difference in cell viability.
Abbreviations: MTX, methotrexate; Gd, gadolinium(III).
Abbreviations: MTX, methotrexate; Gd, gadolinium(III).
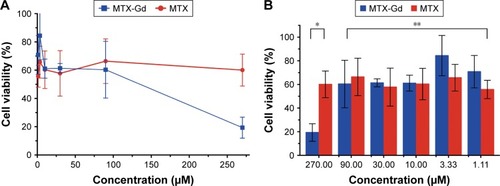
Figure 4 The signal intensity of MTX-Gd, MTX, and Gd-DOTA was measured by MRI in vitro.
Notes: MTX-Gd, MTX, or Gd-DOTA was measured by (A) T1-weighted images and (B) T1-mapping images. In vitro (C) T1-weighted images and (D) T1-mapping images of MTX-Gd at different concentrations (4,000, 2,000, 1,000, 500, 250, 125, and 62.5 μM). In vitro (C) T1-weighted images and (D) T1-mapping images of Gd-DOTA at different concentrations (10,000, 5,000, 2,500, 1,250, 625, 312.5, and 156.25 μM). (E) The curve indicates the gradient concentration with maximum concentration of 2 mM of MTX-Gd, MTX, or Gd-DOTA. (F) The blue line represents the gradient concentration with a maximum concentration of 4 mM of MTX-Gd. The red line represents the gradient concentration with a maximum concentration of 10 mM of Gd-DOTA.
Abbreviations: DOTA, 1,4,7,10-tetraazacyclododecane-1,4,7,10-tetraacetic acid; MRI, magnetic resonance imaging; MTX, methotrexate; Gd, gadolinium(III).
Abbreviations: DOTA, 1,4,7,10-tetraazacyclododecane-1,4,7,10-tetraacetic acid; MRI, magnetic resonance imaging; MTX, methotrexate; Gd, gadolinium(III).
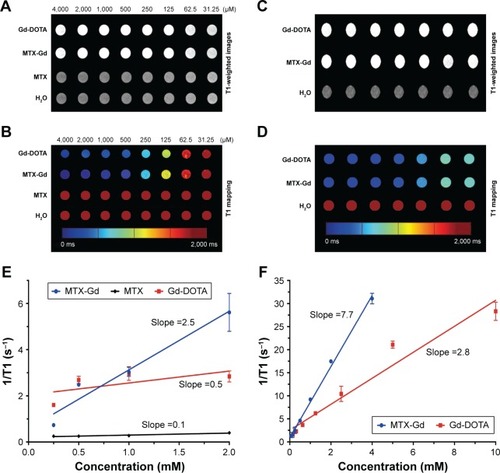
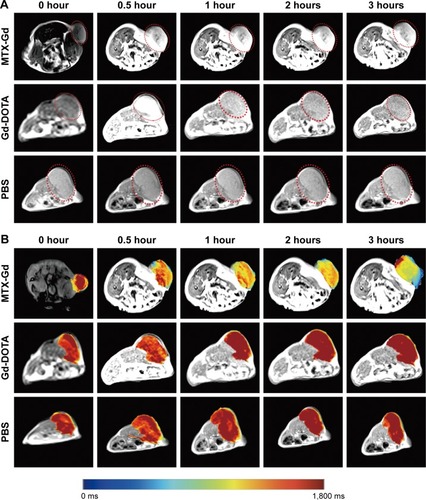
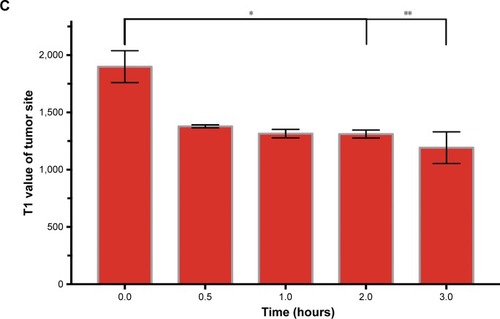
Figure 5 (A) T1-weighted images and (B) the corresponding mapping images of tumors after injection of MTX-Gd, Gd-DOTA, and PBS at different time points. (C) T1-mapping values of tumors were measured after different injection times of MTX-Gd (*P<0.05, **P<0.005).
Abbreviations: DOTA, 1,4,7,10-tetraazacyclododecane-1,4,7,10-tetraacetic acid; MTX, methotrexate; Gd, gadolinium(III).