
Figures & data
Figure 1 Various families of Mdm2 inhibitors shown along with their interaction fingerprints.
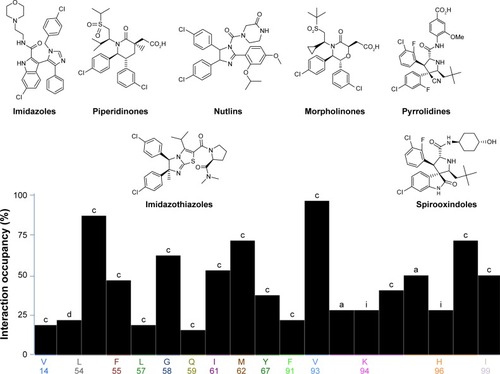
Figure 2 The Mdm2 inhibitor 3D pharmacophore, used to filter out the initial drug-like library, is shown inside the pocket of Mdm2 protein (shown as surface).
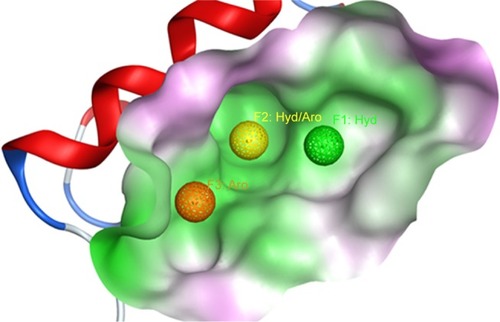
Figure 3 The drug design approach employed in this study to discover new Mdm2–p53 inhibitors.
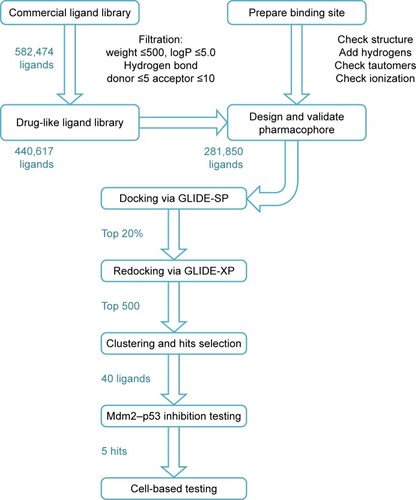
Table 1 Inhibition activity of the tested top docked compounds along with Nutlin 3aCitation20 against the Mdm2–p53 interaction using ELISA
Figure 4 The docked ligand pose of S01 with the p53 binding site of the Mdm2 protein.
Abbreviations: Aro, aromatic; Hyd, hydrophobic.
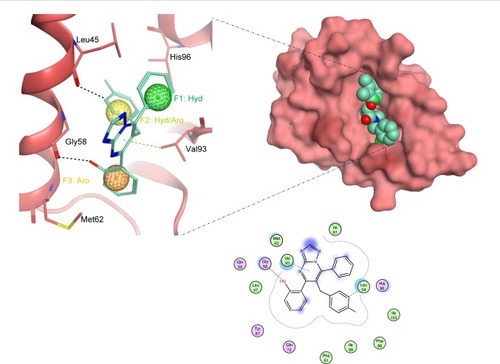
Figure 5 The docked ligand pose of S02 with the p53 binding site of the Mdm2 protein.
Abbreviations: Aro, aromatic; Hyd, hydrophobic.
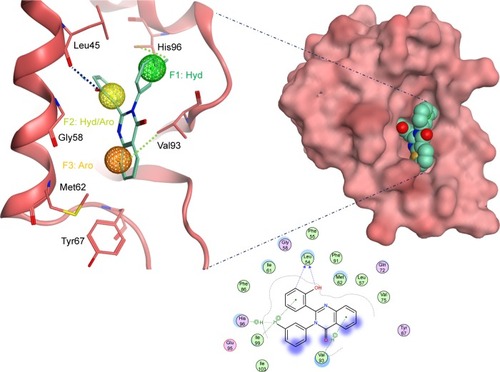
Figure 6 The docked ligand pose of S05 with the p53 binding site of the Mdm2 protein.
Abbreviations: Aro, aromatic; Hyd, hydrophobic.
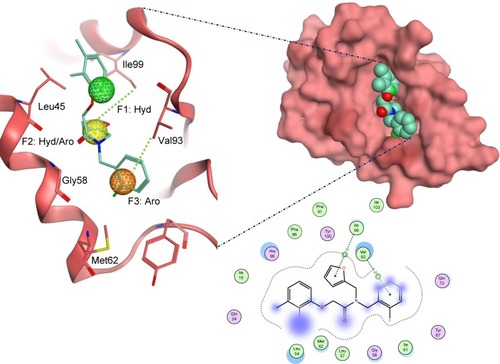
Figure 7 Protein–ligand interaction diagram of S25 (A) and S27 (B).
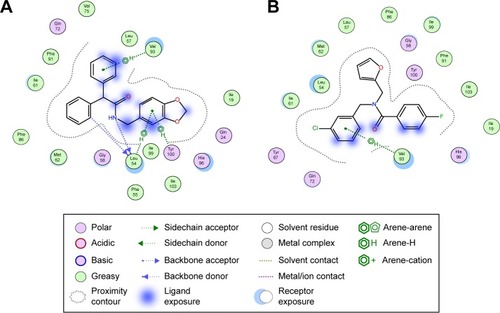
Figure 8 The IC50 values (µM) of the examined inhibitors on three human breast cancer cell lines.
Abbreviation: IC50, inhibitory concentration of 50% of the sample.
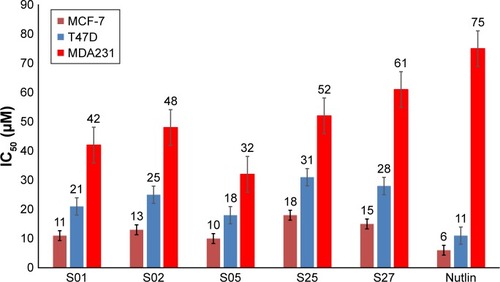
Table 2 Similarity scores of the newly discovered compounds compared to previously known inhibitors