Figures & data
Figure 1 MaR1 alleviated renal injury.
Notes: (A) H&E stain of kidney sections (×400). Compared with the MaR group, there was notably higher tubular damage, including tubular necrosis (red asterisk), cast formation (green asterisk), and the loss of the brush border (yellow asterisk) in the IR group. (B) Results of total histopathologic scores reflecting tubular damage. Plasma levels of BUN (C) and Cr (D) in the MaR group were significantly lower than those of the IR group. n=7 per group. *P<0.05 compared with the IR group.
Abbreviations: BUN, blood urea nitrogen; Cr, creatinine; IR, ischemia/reperfusion group; MaR, IR plus MaR1 group; MaR1, Maresin 1.
Abbreviations: BUN, blood urea nitrogen; Cr, creatinine; IR, ischemia/reperfusion group; MaR, IR plus MaR1 group; MaR1, Maresin 1.
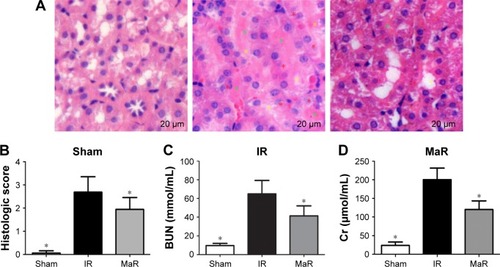
Figure 2 MaR1 decreased inflammation in the kidney after IRI.
Notes: The TNF-α (A) and IL-6 (B) levels in the kidney of the MaR group were significantly lower than those of the IR group. The IL-10 (C) level in the MaR group was markedly higher than that of the IR group. n=7 per group. *P<0.05, compared with the IR group.
Abbreviations: IR, ischemia/reperfusion group; IRI, ischemia/reperfusion injury; MaR, IR plus MaR1 group; MaR1, Maresin 1; TNF-α, tumor necrosis factor alpha.
Abbreviations: IR, ischemia/reperfusion group; IRI, ischemia/reperfusion injury; MaR, IR plus MaR1 group; MaR1, Maresin 1; TNF-α, tumor necrosis factor alpha.
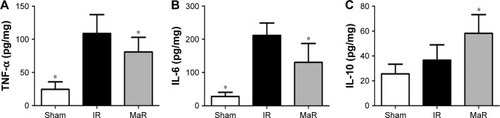
Figure 3 MaR1 inhibited the expression of TLR4 in the kidney after IRI.
Notes: (A) Western blotting band of TLR4. Protein expression of TLR4 (B) was remarkably lower in the MaR group than that in the IR group. n=7 per group. *P<0.05, compared with the IR group.
Abbreviations: IR, ischemia/reperfusion group; IRI, ischemia/reperfusion injury; MaR, IR plus MaR1 group; MaR1, Maresin 1.
Abbreviations: IR, ischemia/reperfusion group; IRI, ischemia/reperfusion injury; MaR, IR plus MaR1 group; MaR1, Maresin 1.
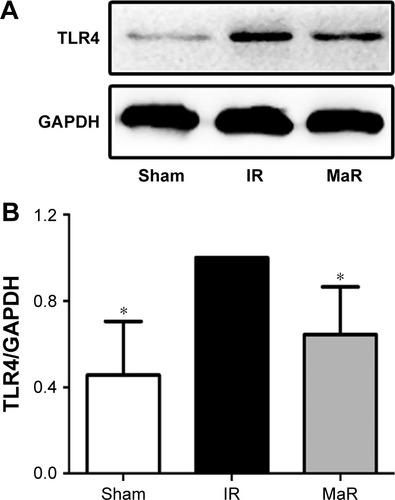
Figure 4 MaR1 inhibited MAPK/NF-κB pathways in the kidney after IRI.
Notes: (A) Representative Western blots. The bar graphs (B–E) reveal that the MaR group had lower phosphorylation levels of Erk, P38, and JNK proteins and lower nuclear NF-κB protein than those of the IR group. n=7 per group. *P<0.05, compared with the IR group.
Abbreviations: IR, ischemia/reperfusion group; IRI, ischemia/reperfusion injury; MaR, IR plus MaR1 group; MaR1, Maresin 1.
Abbreviations: IR, ischemia/reperfusion group; IRI, ischemia/reperfusion injury; MaR, IR plus MaR1 group; MaR1, Maresin 1.
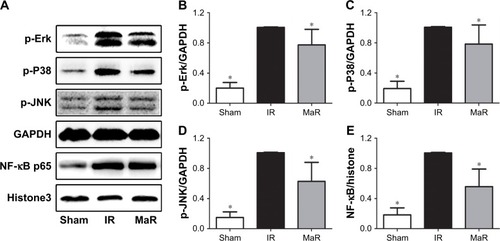
Figure 5 MaR1 suppressed oxidative stress in the kidney after IRI.
Notes: Compared to the IR group, renal MDA (A) and 15-F2t-isoprostane (B) levels were lower in the MaR group. n=7 per group. *P<0.05, compared with the IR group.
Abbreviations: IR, ischemia/reperfusion group; IRI, ischemia/reperfusion injury; MaR, IR plus MaR1 group; MaR1, Maresin 1; MDA, malondialdehyde.
Abbreviations: IR, ischemia/reperfusion group; IRI, ischemia/reperfusion injury; MaR, IR plus MaR1 group; MaR1, Maresin 1; MDA, malondialdehyde.
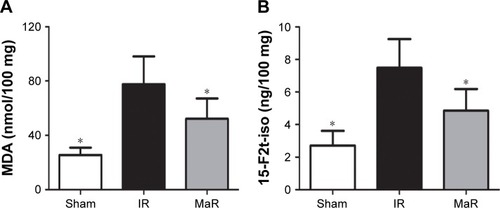
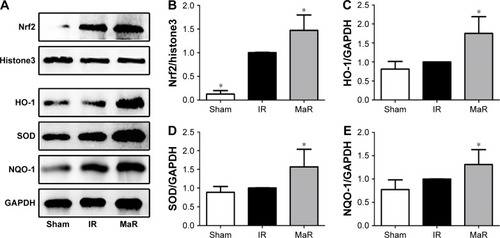
Figure 6 MaR1 improved the activation of the Nrf2 pathway in the kidney after IRI.
Notes: (A) Representative Western blots. The bar graphs (B–E) reveal that the MaR group had higher HO-1, SOD, and NQO-1 protein levels and higher nuclear Nrf2 protein than those of the IR group. n=7 per group. *P<0.05, compared with the IR group.
Abbreviations: IR, ischemia/reperfusion group; IRI, ischemia/reperfusion injury; MaR, IR plus MaR1 group; MaR1, Maresin 1.
Abbreviations: IR, ischemia/reperfusion group; IRI, ischemia/reperfusion injury; MaR, IR plus MaR1 group; MaR1, Maresin 1.