Figures & data
Figure 1 Flow diagram of the selection process.
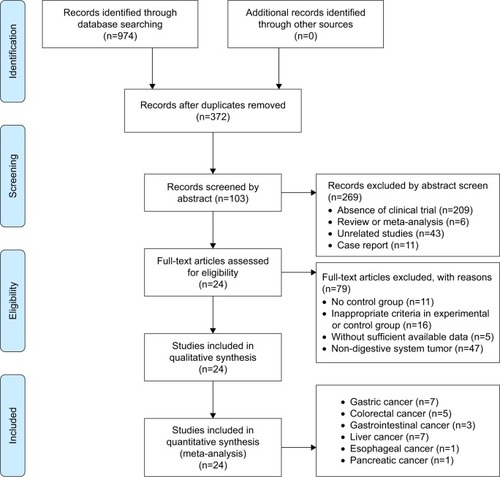
Table 1 Clinical information from the eligible trials in the meta-analysis
Table 2 Information of SC/B6 combined with conventional medical treatment
Figure 2 Risk of bias summary: review of authors’ judgments about each risk of bias item for included studies.
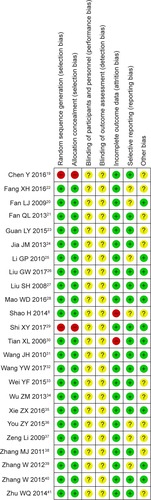
Table 3 Comparison of CR, PR, SD, PD, ORR, and DCR between the SC/B6 + CMT and SC/B6 group
Figure 3 Forest plot of the comparison of overall survival between the experimental and control groups.
Abbreviations: CMT, conventional medical treatment; IV, intravenous.
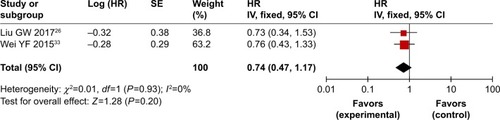
Figure 4 Forest plot of the comparison of overall response rate (A) and disease control rate (B) between the experimental and control groups.
Abbreviations: CMT, conventional medical treatment; M–H, Mantel–Haenszel.
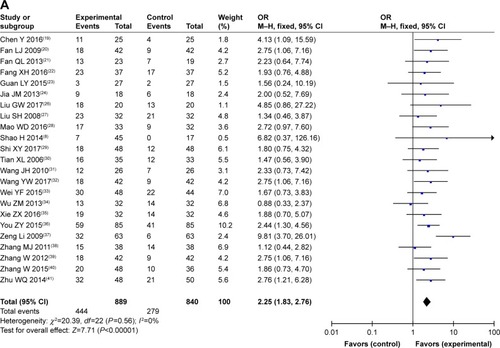
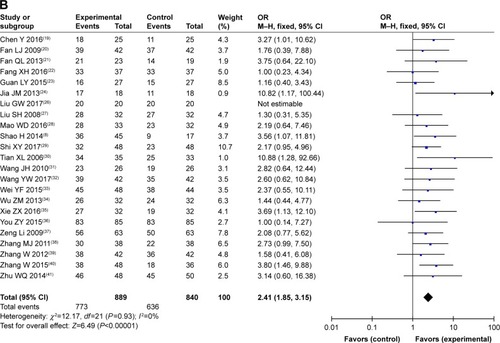
Figure 5 Forest plot of the comparison of quality-of-life improved rate between the experimental and control groups.
Abbreviations: CMT, conventional medical treatment; M–H, Mantel–Haenszel; SC/B6, sodium cantharidinate and vitamin B6 injection.
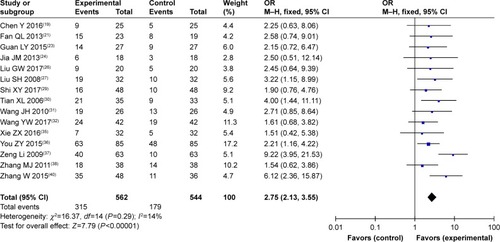
Table 4 Comparison of adverse events between the SC/B6 + CMT and SC/B6 group
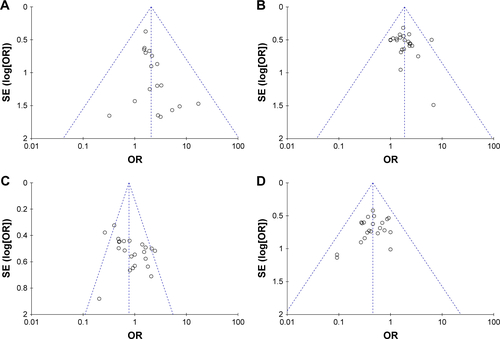
Figure 6 Funnel plot of percentage of overall response rate (A), disease control rate (B), quality-of-life improved rate (C), leukopenia (D), nausea and vomiting (E), gastrointestinal side effects (F), and hepatotoxicity (G).
Table 5 Publication bias on therapeutic efficacy and adverse events
Table 6 Subgroup analyses of ORR and DCR between the SC/B6 + CMT and SC/B6 groups
Figure S1 Forest plot of the comparison of complete response rates (A), partial response rates (B), stable disease rates (C), and progressive disease rates (D) between the experimental and control groups. Control group, CMT alone group; Experimental group, sodium cantharidinate and vitamin B6 injection (SC/B6) + CMT. The fixed-effects meta-analysis model (M–H method) was used.
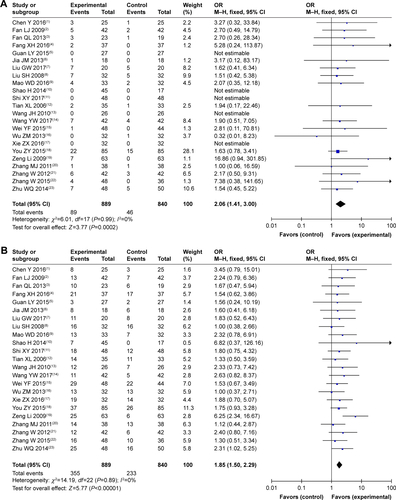
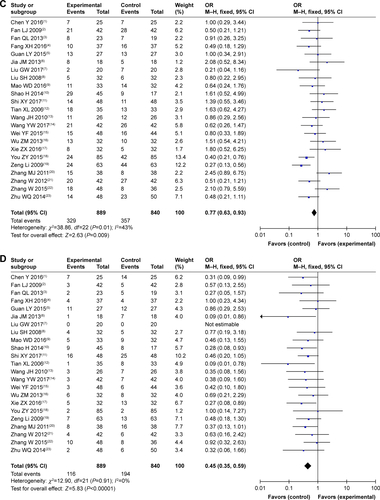
Figure S2 Forest plot of the comparison of adverse effects including leukopenia (A), nausea and vomiting (B), gastrointestinal side effects (C), hepatotoxicity (D), nephrotoxicity (E), diarrhea (F), thrombocytopenia (G), transaminase disorder (H), myelosuppression (I), hand foot syndrome (J), oral mucositis (K), anorexia (L), and anemia (M) between the experimental and control groups. Control group, CMT-alone group; Experimental group, sodium cantharidinate and vitamin B6 injection (SC/B6) + CMT.
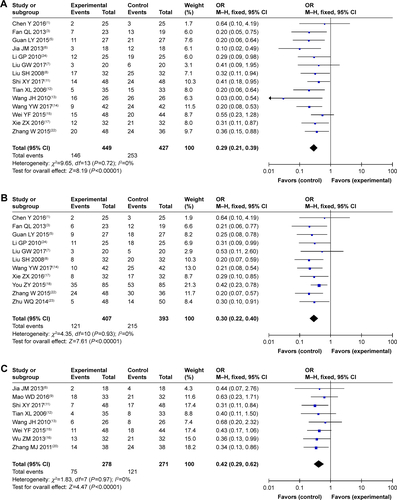
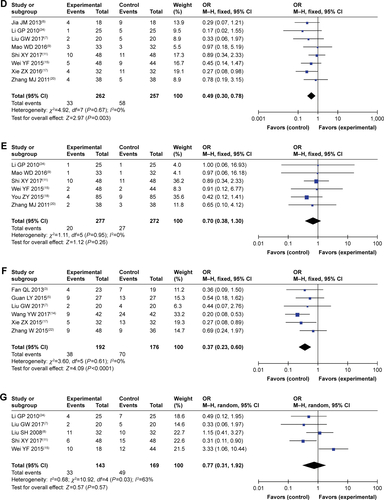
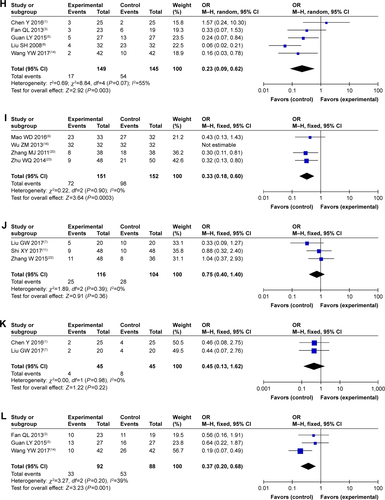
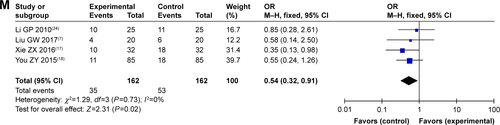
Figure S3 Funnel plot of percentage of complete response rates (A), partial response rates (B), stable disease rates (C), and progressive disease rates (D).