Figures & data
Figure 1 Chemical structure of bivalent Smac mimetics. (A) 8 bivalent Smac mimetics studied in this paper and their binding affinities to XIAP.Citation28 (B) The reaction coordinates associated with compound 9 shown in CPK representation, where C atoms are colored cyan, N blue and O red. The reaction coordinate ξ is the distance B3-B2, and the reaction coordinate α is the dihedral B3-L3-L2-B2. Points B3 (the large red ball) and B2 (the large blue ball) are the centers of mass of the (8,5)-bicyclic cores of the AT-406 parts, and points L3 and L2 (the two black balls) are the terminal atoms of the linker chain connected to the AT-406 parts.
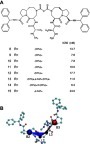
Figure 2 Flowchart of the TwistDock workflow, including the preparation of ligand (bivalent Smac mimetic) and construction of bivalent complex.
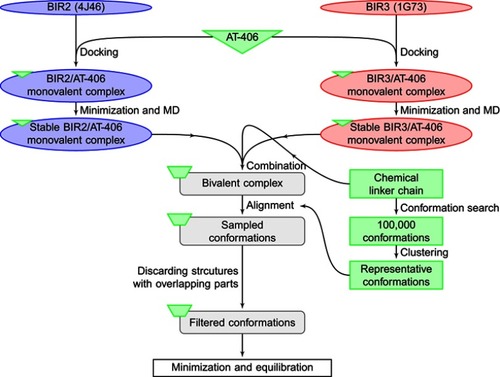
Figure 3 Conformational spaces of 8 bivalent complexes sampled by TwistDock, projected on reaction coordinates distance B3-B2 (ξ) and dihedral B3-L3-L2-B2 (α). Red crosses denote invalid conformations that have serious structural clashes, while green circles denote valid conformations. The bivalent complex is formed by the BIR2 and BIR3 domains and one of the bivalent Smac mimetics (A to H correspond to compounds 8 to 15). (Compound 9 has the compact conformational space, which is viable to explore).
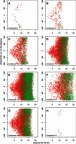
Figure 4 Circular distribution of the dihedral B3-L3-L2-B2 (α) denoting the global conformation of the bivalent complex. The bivalent complex is formed by the BIR2 and BIR3 domains and one of the bivalent Smac mimetics (A to H correspond to compounds 8 to 15). Samples from first 1.2 ns equilibration (gray, inner circle) and then 800 ps equilibration (black, outer circle) are shown as stacked points, and the circular mean values are shown.
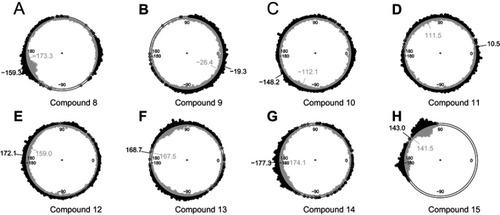
Figure 5 The free energy landscape of bivalent complex formed by compound 9 and the BIR2 and BIR3 domains of XIAP, projected on two reaction coordinates, the distance B3-B2 (ξ) and the dihedral B3-L3-L2-B2 (α).
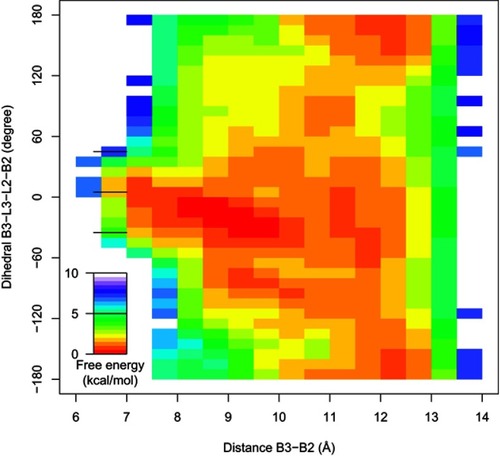
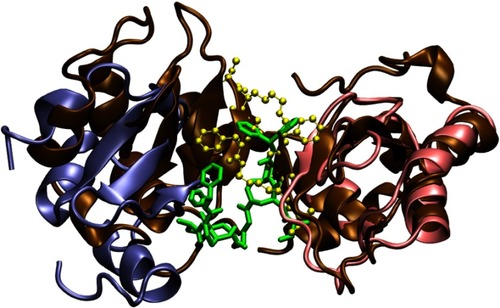
Figure 6 Three structures of the bivalent complex formed by BIR2, BIR3 and compounds 9. The bivalent ligand (colored in green) has two binding motifs interacting with BIR2 (ice blue) and BIR3 (pink). Residues surrounding the binding sites are shown in the Licorice and colored by their charge (red for negative, blue for positive and white for neutral). Residues that maintain interactions between the BIR2 and BIR3 domains are labeled with residue names and numbers. The N-terminals of BIR2 and BIR3 are highlighted with blue balls, while the C-terminals, red balls.
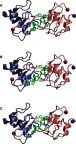
Table S1 The clustering results of the linker conformations
Table S2 Three sets of cutoff for clustering
Figure S1 Structures of the monovalent complex formed by BIR3 and AT-406. The docking structure (A) with the highest docking score was selected and further subjected to a 25 ns MD. This structure has a binding mode similar to the complex in PDB entry 1G73, and the RMSD between backbone heavy atoms of AVPI in 1G73 and the corresponding atoms of AT-406 is 1.056Å (calculated by VMD). The structure (B) after 25 ns MD was used to construct the bivalent complex. The structures of BIR3 and AVPI in PDB entry 1G73 are shown in the pink NewCartoon and the yellow CPK representations, respectively, while the docked AT-406 is shown in the green Licorice representation. The structure of BIR3 after 25 ns MD is shown in ochre NewCartoon representation. The zinc atom (the gray ball) is not involved in the binding site.
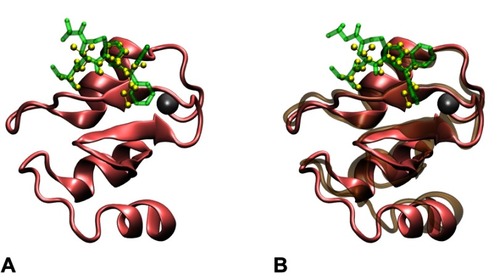
Figure S2 Structures of the monovalent complex formed by BIR2 and AT-406. Among the top three docking structures (A, B and C), the third structure (C) was selected and subjected to a 25 ns MD run, since it has a binding mode most similar (RMSD 1.123Å) to the complex formed by the AVPI sequence and the BIR2 domain in PDB entry 4J46. The RMSD is calculated between backbone heavy atoms of AVPI in 4J46 and the corresponding atoms of AT-406. The structure (D) after the 25 ns MD was used to construct the bivalent complex. In contrast, for (A) and (B) the corresponding RMSDs are 1.866Å and 1.130Å. The structures of BIR2 and AVPI in PDB entry 4J46 are shown in the iceblue NewCartoon and the yellow CPK representations, while the docked AT-406 is shown in the green Licorice representation. The structure of BIR2 after the MD run is shown in the ochre NewCartoon representation in (D). The zinc atom (the gray ball) is not involved in the binding site.
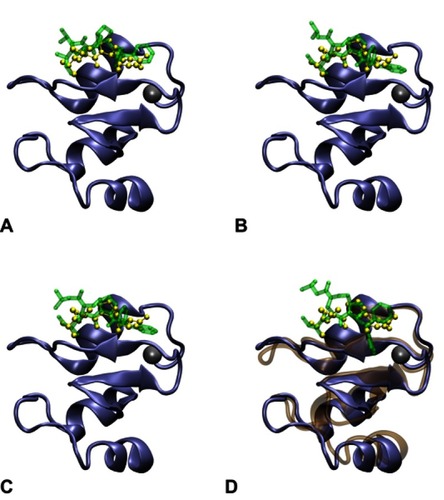
Figure S3 Distributions of clusters are insensitive to the clustering cutoff. For a bivalent complex, distributions are obtained in three sets of cutoff for clustering, where “standard” is the condition set used to produce the structures for the subsequent minimization and MD, “stringent” is the condition set resulting more structures and “loose” is the condition set resulting fewer structures. The names of the compounds that participate the formation of bivalent complexes are shown on the top line. In each distribution histogram, the x-axis denotes the value of (A) radius of gyration of the bivalent complex (Rgyr) or (B) the dihedral B2-L2-L3-B3, while the y-axis denotes the number of structures.
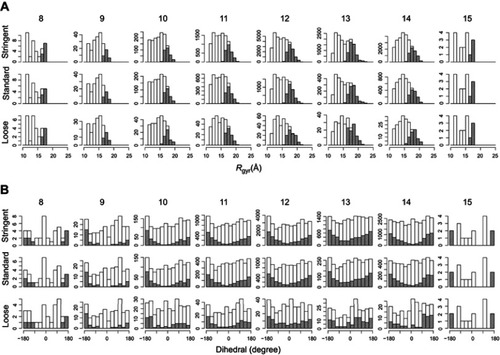
Figure S4 Distribution of the complex enthalpy. We only compared the complex enthalpy among structures of an ensemble of the same complex. Small verticle lines near the x-axis (a rug representation) indicate the 10 lowest values of the enthalpy of conformations of a complex.
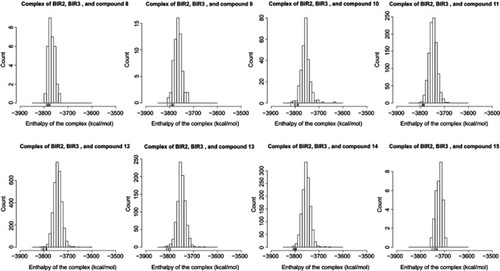
Figure S5 Comparison of a bivalent complex formed by BIR2, BIR3 and compounds 9, and a complex formed by two BIR3 domains and a bivalent Smac mimetic (PDB entry 2VSL). The structure of the complex formed by BIR2, BIR3 and compound 9, respectively, shown in iceblue and pink NewCartoon, and green Licorice, is the same one shown in . In this structure, the arrangement of the BIR2 and BIR3 domains is compact, similar to PDB entry 2VSL, whose BIR3 domains are shown in ochre NewCartoon representation and the ligand in yellow CPK representation.