132
Views
3
CrossRef citations to date
0
Altmetric
Original Research

A novel non-invasive monitoring assay of 5-azacitidine efficacy using global DNA methylation of peripheral blood in myelodysplastic syndrome

, , , , , , , , & show all
Pages 1821-1833 | Published online: 30 May 2019

Figures & data

Table 1 Methylation index of patients with myelodysplastic syndrome and post-MDS AML

Figure 1 Methylation index (MI) measured using a single-molecule methylation assay (SMMA). The percent of methylation DNA in the sample is shown. (A). MI of whole blood. (B). MI of the neutrophil fraction. (C). MI of mononuclear cells. (D). MI is significantly increased in MDS patients with a very poor cytogenetic score according to the Revised International Prognostic Scoring System.

Abbreviations: MDS, myelodysplastic syndrome; post MDS-AML, post myelodysplastic acute myeloid leukemia.
Figure 1 Methylation index (MI) measured using a single-molecule methylation assay (SMMA). The percent of methylation DNA in the sample is shown. (A). MI of whole blood. (B). MI of the neutrophil fraction. (C). MI of mononuclear cells. (D). MI is significantly increased in MDS patients with a very poor cytogenetic score according to the Revised International Prognostic Scoring System.

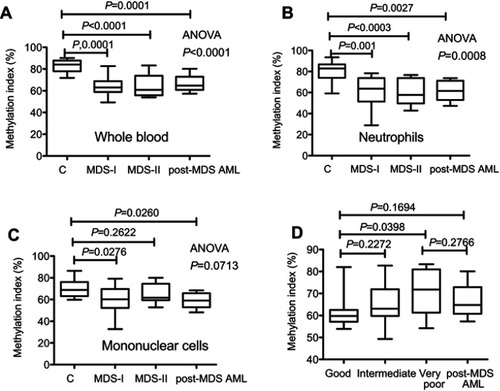
Table 2 Clinical response to AZA in 13 patients whose methylation index was subsequently measured

Figure 2 The restoration rate of methylation for AZA-treated patients. (A). ∆MI at day 28 (MIdayCitation28 – MIday0) for AZA responders was significantly higher than that of non-responders (P=0.0352). (B). ∆MI at day 120 was significantly higher than that of non-responders (P=0.0251). (C). For AZA responders, ∆MI at day 120 was significantly higher than at day 28 (P=0.0216). (D). For AZA non-responders, there was no significant difference between ∆MI at day 28 and at day 120 (P=0.2961).

Note: *Represents a significant difference.
Abbreviation: MI, methylation index.
Figure 2 The restoration rate of methylation for AZA-treated patients. (A). ∆MI at day 28 (MIdayCitation28 – MIday0) for AZA responders was significantly higher than that of non-responders (P=0.0352). (B). ∆MI at day 120 was significantly higher than that of non-responders (P=0.0251). (C). For AZA responders, ∆MI at day 120 was significantly higher than at day 28 (P=0.0216). (D). For AZA non-responders, there was no significant difference between ∆MI at day 28 and at day 120 (P=0.2961).

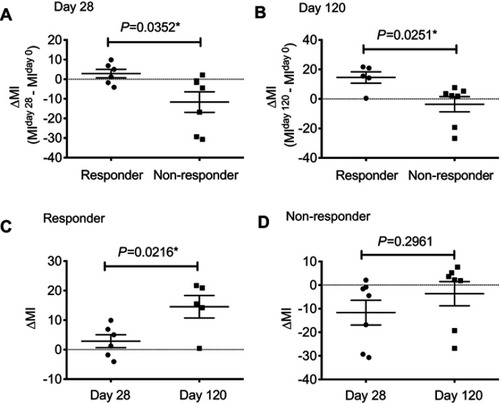
Table S1 Mutation analysis using the GeneRead DNAseq Targeted Panel V2 (Human Myeloid Neoplasms Panel; Qiagen)