Figures & data
Figure 1 Combination of emodin with PTX synergistically inhibited the proliferation of A549 cells. (A) The chemical structure of emodin. (B) Cell viability was determined using CCK-8 assay in A549 cells treated with emodin (0, 10, 20, 40, 80, 120 μM) for 72 hr. (C) Cell viability was determined using CCK-8 assay in A549 cells treated with PTX (0, 2, 4, 6, 8, 16, 32 μM) for 72 hr. (D) Cell viability was determined using CCK-8 assay in A549 cells treated with PTX (4 μM) and emodin (0, 5, 10, 20, 40 μM) for 72 h. **P< 0.01 compared with 0 μM group; ##P< 0.01 compared with 4 μM PTX alone group. Each group performed at least three independent experiments.
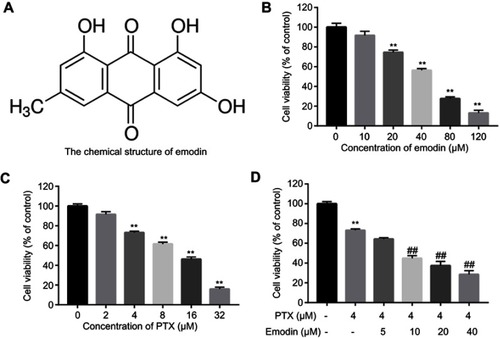
Table 1 Evaluation of combination of PTX with emodin in NSCLC (72 hr treatment)
Figure 2 Emodin could enhance PTX-induced apoptosis in A549 cells. A549 cells were treated with 4 μM PTX or/and 10 μM emodin for 72 h.r (A) Relative fluorescence expression levels were quantified by Ki67 and DAPI staining. The number of Ki67 positive cells were counted. (B) Apoptotic cells were detected with Annexin V and PI double staining. The apoptosis cell rates were calculated. (C) The expressions of Bax, Bcl-2 and active caspase 3 were analyzed by Western blotting in A549 cells. (D) The relative expression of Bax was quantified by normalizing to β-actin. (E) The relative expression of Bcl-2 was quantified by normalizing to β-actin. (F) The relative expression of active caspase 3 was quantified by normalizing to β-actin. *P< 0.05, **P<0.01 compared with control group; #P< 0.05, ##P< 0.01 compared with 4 μM PTX alone group. Each group performed at least three independent experiments.
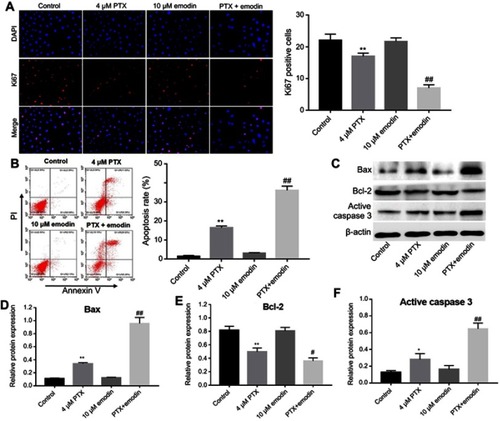
Figure 3 Combination of emodin with PTX inhibited Akt and ERK pathways in A549 cells. A549 cells were treated with 4 μM PTX or/and 10 μM emodin for 72 hr. (A) The expressions of p-Akt and p-ERK in A549 cells were analyzed by Western blotting. (B) The relative expression of p-Akt was quantified by normalizing to Akt. (C) The relative expression of p-ERK was quantified by normalizing to ERK. *P< 0.05 compared with control group. ##P< 0.01 compared with 4 μM PTX group. Each group performed at least three independent experiments.
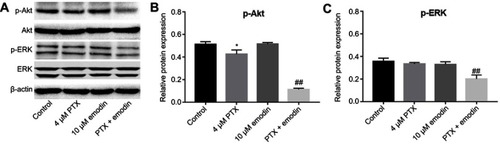
Figure 4 Emodin could enhance the antitumor effects of the PTX on NSCLC in vivo. (A) Tumor volumes of xenograft were measured weekly post-inoculation of A549 cells. (B) Tumors were isolated from xenografts and pictured after 3 weeks of treatment. (C) Tumor weights in each group were calculated. (D) Body weights of mice were calculated. N = 4, **P< 0.01 compared with vehicle group; ##P< 0.01 compared with 10 mg/kg PTX group.
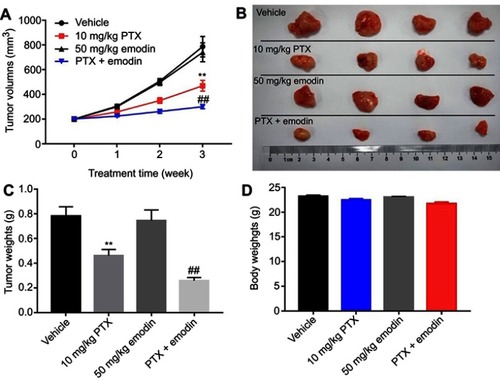
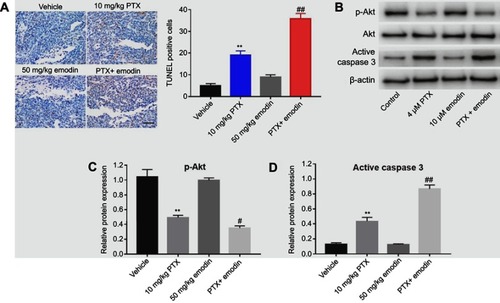
Figure 5 Combination of emodin with PTX-induced apoptosis in tumor tissues via inhibition of Akt signaling pathway in vivo. (A) TUNEL staining of tumor tissues in each group. Quantification of TUNEL positive cells in tissues. (B) Expressions of p-Akt and active caspase 3 were analyzed by Western blotting in A549 cells. (C) Relative expression of p-Akt was quantified by normalizing to Akt. (D) Relative expression of active caspase 3 was quantified by normalizing to β-actin. **P< 0.01 compared with vehicle group; #P< 0.05, ##P< 0.01 compared with 10 mg/kg PTX group. Each group performed at least three independent experiments.