Figures & data
Figure 1 Scheme graph (A) and TEM image (B) of doxorubicin and β-elemene co-loaded, pH-sensitive nanostructured lipid carriers (DOX/ELE Hyd NLCs).
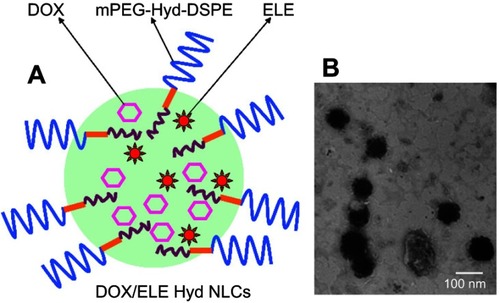
Table 1 EE and DL of NLCs (mean ± SD, n=3)
Figure 2 Particle sizes (A), polydispersity indices (B), and zeta potentials (C) of NLCs. Data are presented as mean ± SD, n=10.
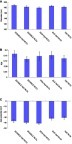
Figure 3 Plasma stability of NLCs evaluated simulated in 10% FBS. NLCs showed no significant size (A) and PDI (B) changes during the 72-hr test. Data are presented as means ± SD, n=10.
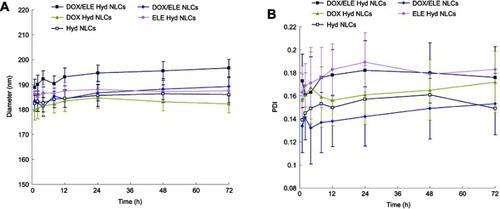
Figure 4 In vitro release behavior of pH-sensitive DOX/ELE Hyd NLCs (A) and DOX/ELE NLCs (B) at pH 5.5 and 7.4. Data are presented as means ± SD, n=3.
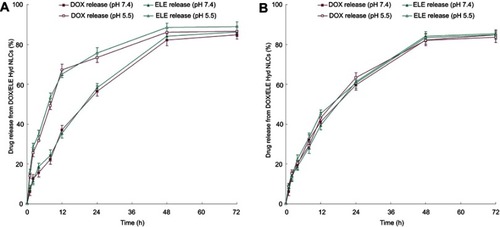
Figure 5 Cellular uptake efficiency of NLCs was illustrated by coumarin-6-loaded NLCs in A549/ADR cells: flow cytometery results (A) and microscopy images. (B) Data are presented as means ± SD, n=6.
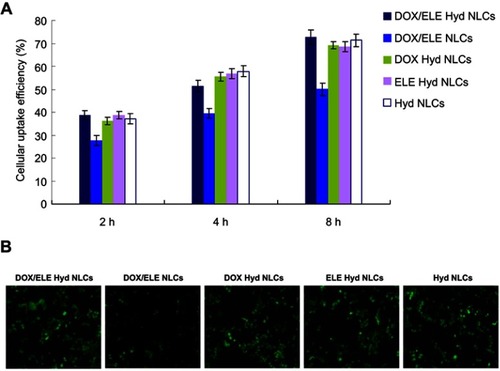
Figure 6 In vitro cytotoxicity of NLCs was evaluated on both A549 (A), A549/ADR cells (B), and MRC-5 cells (C). CI50 was measured to validate the synergistic effect (D). Data is presented as mean ± SD, n=6.
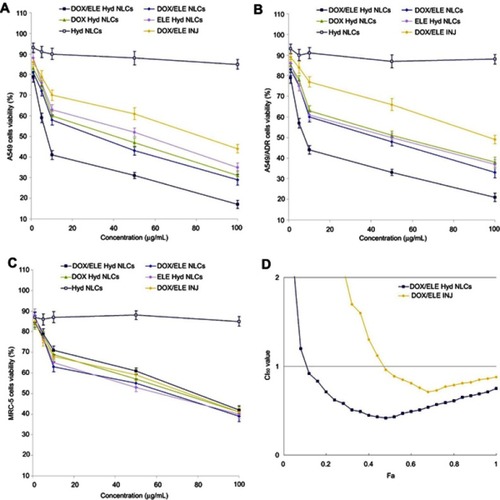
Figure 7 In vivo tissue distribution of NLCs and drugs injection (INJ) in tumor xenografts: DOX distribution at 1 hr (A) and 24 hr (B); ELE distribution at 1 hr (C) and 24 hr (D). Data is presented as means ± SD, n=8.
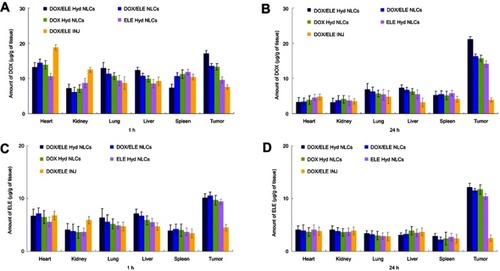
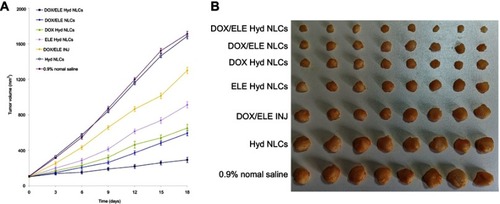
Table 2 Tumor inhibition ratios (mean ± SD, n=3)
Figure 8 In vivo anticancer activity presented as tumor growth curves (A) and tumor images (B) of each group. Data is presented as means ± SD, n=8.