Figures & data
Table 1 Separation procedures of prep-HPLC for fractions IV and VI
Figure 1 HPLC chromatograms of (A) ethanol extracts, (B) ethanol extracts reacted with DPPH• and prep-HPLC chromatograms of (C) fractions IV and (D) VI.
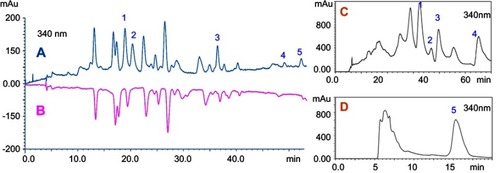
Figure 2 Chemical structures of five antioxidants found in L. chinensis (Jacq.) R. Brown leaves.
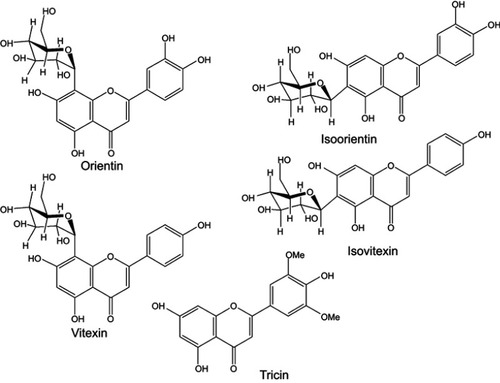
Table 2 IC50 values of five compounds and ascorbic acid in scavenging DPPH• (n=6)
Figure 3 An inverted microscope was used to observe the cell morphology and survival under different treatment conditions. (A) Normal H9c2 cells; (B–F) H9c2 cells intervened with 40 μg/mL of orientin, isoorientin, vitexin, isovitexin, and tricin concentrations for 24 hrs; (G) survival rates of H9c2 cells corresponding to the B–F group. **p<0.01 indicates significant difference from the control.
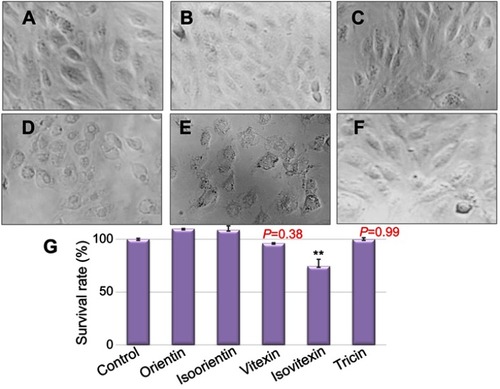
Figure 4 Time-dependent relationship of survival rate improvement by pretreating with different compounds (5 μg/mL, **p<0.01 vs control models).
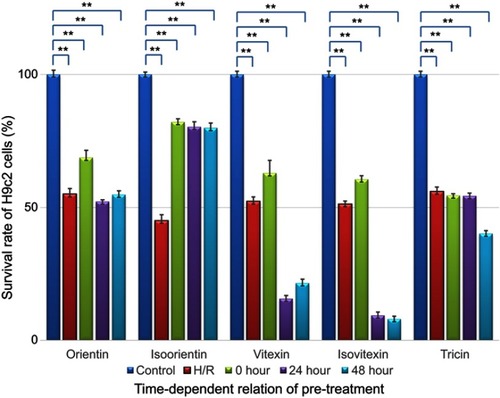
Figure 5 Dose-dependent relationship of survival rate improvement with different compounds (0 hr of pretreatment in H/R injury models, n=6), **p<0.01 vs control models showed significant difference from control.
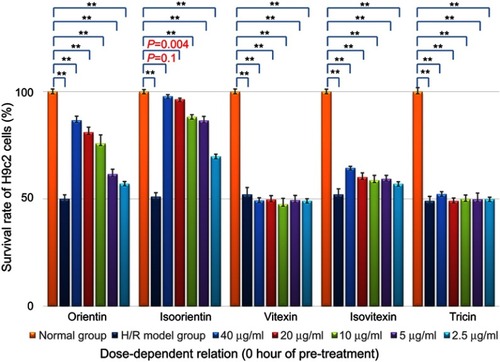
Figure 6 Dose-dependent relationship of survival rate improvement by treatment with different compounds (in H2O2-induced injury models, n=6), **p<0.01 vs control models.
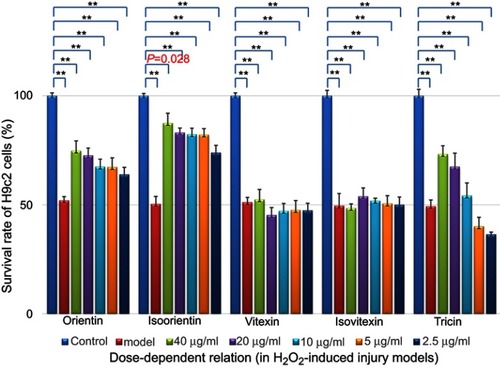
Figure 7 Dose-dependent relationship of survival rate improvement by treatment with different compounds (in ADM-induced injury models, n=6); **p<0.01 showed significant difference from the control.
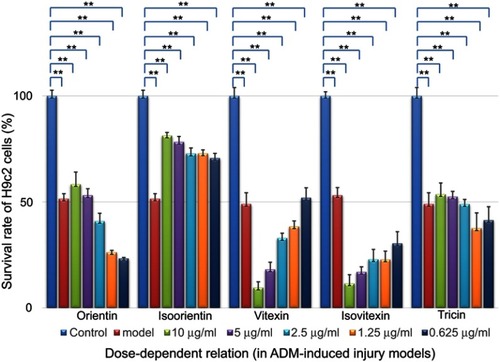
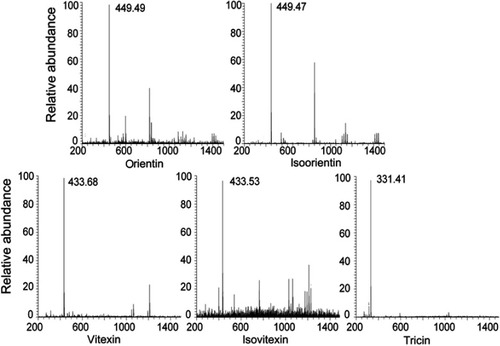
Figure S1 Mass spectrometric data of five compounds.