Figures & data
Figure 1 Emodin suppressed the proliferation of L02 cells. (A) The chemical structure of emodin. (B and C) L02 cells were treated with different concentrations of emodin for 24 h or with emodin (160 µM) for different time intervals. Cell viability was determined by CCK-8 assay. Data are presented as the means ± SDs for 3 independent experiments. *P<0.05 compared with the control group; **P<0.01 compared with the control group. (D) Representative photos depict the morphology of L02 cells exposed to various concentrations of emodin for 24 h. Scale bars: 100 μm.
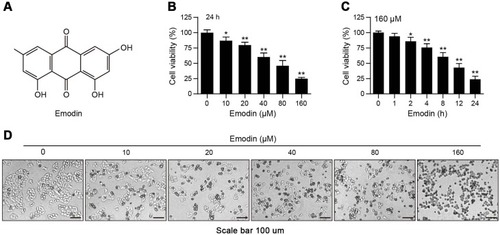
Figure 2 Emodin induced apoptosis in L02 cells through activating caspase-3. (A and B) L02 cells were treated with different concentrations of emodin for 24 h or with 160 µM emodin for different time intervals. Cell apoptosis was detected by flow cytometry using annexin V/PerCP staining. Representative flow cytometric images and statistical data are showed, and the data are presented as means ± SDs for 3 independent experiments. *P<0.05 compared with the control group; **P<0.01 compared with the control group. (C and D) Cells were treated as in (A) and (B), respectively, and then subjected to Western blot analysis to determine the expression of c-caspase-3. Actin was used as a loading control. (E) The intensities of c-caspase-3 in (C) and (D) normalized to actin were statistically analysed and represented as the mean ± SD for 3 independent experiments. *P<0.05 compared with the control group; **P<0.01 compared with the control group. (F) The intensities of c-caspase-3 in (D) normalized to actin were statistically analysed and represented as the mean ± SD for 3 independent experiments. *P<0.05 compared with the control group; **P<0.01 compared with the control group.
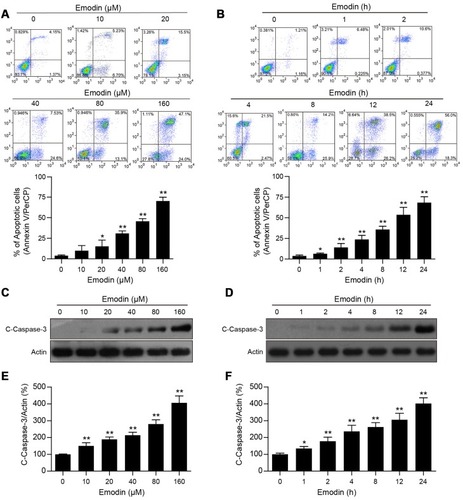
Figure 3 Emodin induced autophagic alterations in L02 cells. (A and B) Cells were treated with different concentrations of emodin for 24 h or with emodin (160 µM) for different time intervals. The expression of LC3B-I/II was analysed by Western blot. (C and D) The intensities of LC3B-II in (A and B) normalized to actin were statistically analysed and represented as the mean ± SD for 3 independent experiments. *P<0.05 compared with the control group; **P<0.01 compared with the control group. (E) GFP-LC3 expression in L02 cells treated with or without emodin (80 µM) for 12 h. GFP-LC3 puncta were examined using confocal microscopy; scale bars: 10 μm. (F) The average number of GFP-LC3 puncta per cell in (E) was quantitated from 3 independent experiments. Data are presented as the mean ± SD for 3 independent experiments. Thirty cells were analysed per treatment condition. **P<0.01 compared with the control group.
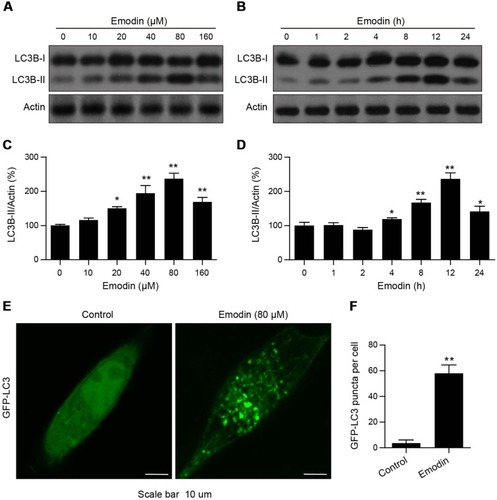
Figure 4 Emodin inhibited the PI3K/AKT/mTOR pathway. (A) L02 cells were treated with different concentrations of emodin for 24 h. The expression of p-PI3K(Tyr485), PI3K, p-AKT (Thr308), AKT, p-mTOR (Ser2448) and mTOR were analysed by Western blot. (B) The intensities of p-PI3K, p-AKT and p-mTOR in (A) normalized to actin were statistically analysed and represented as the mean ± SD for 3 independent experiments. *P<0.05 compared with the control group; **P<0.01 compared with the control group.
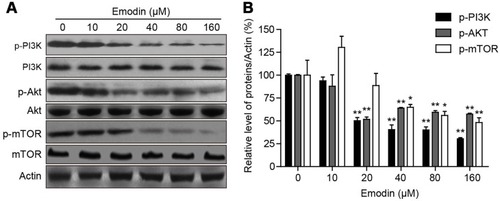
Figure 5 Emodin-induced autophagy played a protective role in L02 cells. (A) Cells were treated with or without emodin (40 µM) in the absence or presence of 3-MA (5 mM) for 24 h. The expression of LC3B-I/II was analysed by Western blot. (B) The intensities of LC3B-II in (A) normalized to actin were statistically analysed and represented as the mean ± SD for 3 independent experiments. **P<0.01. (C) Cell viability in (A) was determined by CCK-8 assay. Data are presented as the means ± SDs for 3 independent experiments. **P<0.01. (D) Cell apoptosis in (A) was detected by flow cytometry using annexin V/PerCP staining. Data are presented as the means ± SDs for 3 independent experiments. (E) Representative photos depicting the morphology of L02 cells treated in (A) Scale bars: 100 μm. (F) Cells were treated with or without emodin (40 µM) in the absence or presence of rapamycin (Rapa; 100 nM) for 24 h. The expression of LC3B-I/II was analysed by Western blot. (G) The intensities of LC3B-II in (F) normalized to actin were statistically analysed and are represented as the mean ± SD for 3 independent experiments. **P<0.01. (H) Cell viability in (F) was determined by CCK-8 assay. Data are presented as the means ± SDs for 3 independent experiments. **P<0.01. (I) Cell apoptosis in (F) was detected by flow cytometry using annexin V/PerCP staining. Data are presented as the means ± SDs for 3 independent experiments. (J) Representative photos depicting the morphology of L02 cells treated in (F). Scale bars: 100 μm.
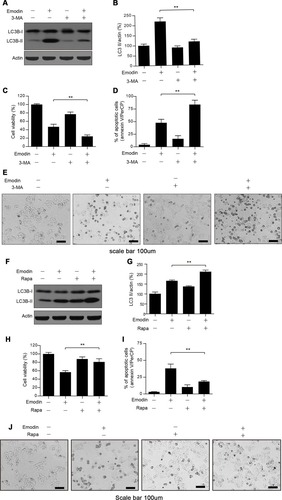
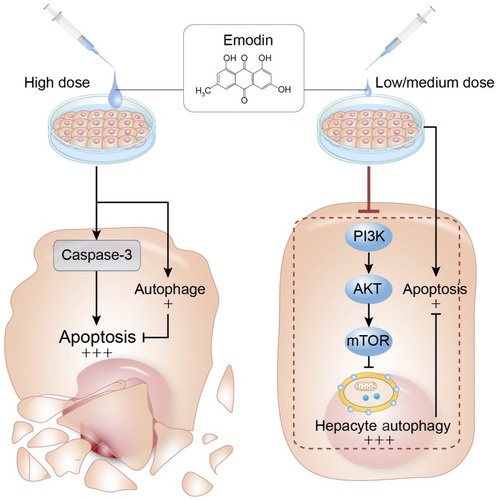
Figure 6 Summary of the current study. At low/medium concentrations, emodin-induced autophagy hinders apoptosis and maintains L02 cell viability, while high concentrations of emodin induces a marginal autophagy which hardly cope apoptosis and leads cell death. Arrows and black words part represent activation of target molecules or stimulation of production, and blunt lines and grey words part indicate target inhibition.