Figures & data
Table 1 Primers Used For Real-Time qPCR Assay
Figure 1 Luteolin administration did not affect hyperlipidemia profile in HFD-fed ApoE-/- mice.
Notes: Luteolin failed to alter HFD-induced increased serum levels of LDL-C (A), HDL-C (B), TCH (C) and TG (D) (n=14 in each group; ##P<0.01, ###P<0.001, vs ND; ns, no significance, vs HFD).
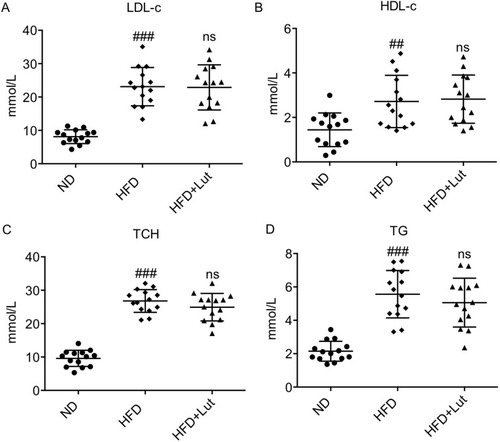
Figure 2 Luteolin administration prevented atherosclerotic plaque development in HFD-fed ApoE−/− mice.
Notes: Luteolin attenuates atherosclerosis plaque formation in the artery (A, B). (A) The atherosclerotic lesion area in aortic arch is reduced in the administration of luteolin. (B) Oil Red O staining showed that atherosclerosis plaque is reduced in the administration of luteolin and quantification of atherosclerotic plaque lesion area. (C) Oil Red O staining in aortic root showed that lipid accumulation is reduced by administration of luteolin quantification of atherosclerotic plaque lesion area (n=7 in each group; ###P<0.001, vs ND; ***P<0.001, vs HFD;).
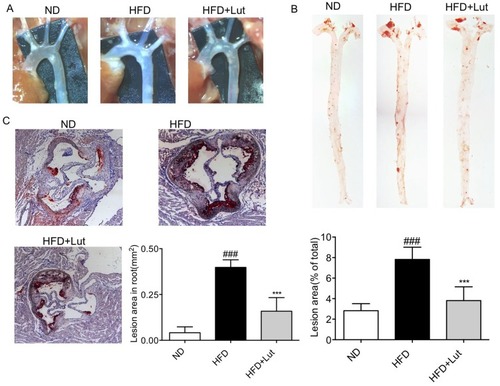
Figure 3 Luteolin administration inhibited inflammation in atherosclerotic aortas.
Notes: Artery tissues from each group were individually processed for RNA extraction and RT-qPCR analysis. The mRNA levels of ICAM-1, VCAM-1, IL-6 and TNF-α were normalized by β-actin (A–D). (E–G) Immunofluorescence staining with anti-Moma-2 in the artery tissues showed that macrophage infiltration was reduced by luteolin. Representative images (E) and analysis (F–G) of immunofluorescence staining with anti-Moma-2. (n=7 in each group; ###P<0.001, vs ND group; *P<0.05, **P<0.01, ***P<0.001, vs HFD group).
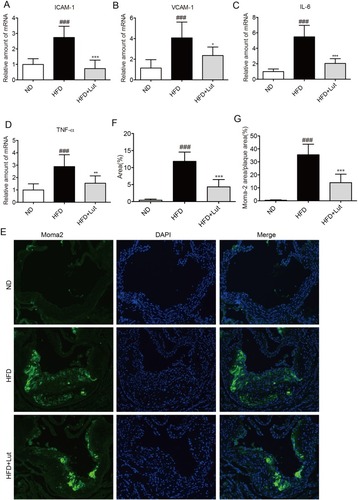
Figure 4 STAT3 phosphorylation in aortas of HFD-fed ApoE−/− mice was increased.
Notes: (A–C) Representative microscopic images and analysis of p-STAT3 staining in artery tissues showed that HFD increased p-STAT3 immunoreactivity in ApoE-/- mouse arteries. Administration of luteolin significantly reduced p-STAT3. (D, E) Western blot analysis of p-STAT3 in artery tissues showed that administration of luteolin significantly reduced p-STAT3 level without changing STAT3 levels. (n=7 in each group; ##P<0.01, ###P<0.001, vs ND group; **P<0.01, ***P<0.001, HFD group).
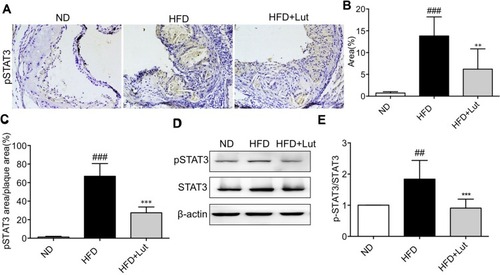
Figure 5 Luteolin suppressed inflammation in oxLDL-stimulated macrophages.
Notes: (A) Luteolin suppressed oxLDL-induced activation of STAT3. Primary macrophages were pretreated with luteolin (Lut, 2.5, 5 or 10 μM), or vehicle (DMSO, 1 μL) for 1 hr and then stimulated with oxLDL (50 µg/mL) for 15 mins. Total proteins were extracted to detect the levels of p-STAT3 and STAT3. (B) Luteolin inhibited oxLDL-induced increase in mRNA levels of inflammatory molecules. Macrophages were pretreated with Lut (2.5, 5 or 10 μM) or vehicle (DMSO, 1 μL) for 1 hr and then stimulated with oxLDL (50 µg/mL) for 6 hrs. Figure showing mRNA levels of ICAM-1, VCAM-1, IL-6 and TNF-α. (C, D) Luteolin inhibited oxLDL-induced release of cytokines. Macrophages were pretreated with Lut (2.5, 5 or 10 μM) or vehicle (DMSO, 1 μL) for 1 hr and then stimulated with oxLDL (50 µg/mL) for 24 hrs. The levels of IL-6 (C) and TNF-α (D) in the culture medium were detected by ELISA. (E) RMSD curves for the 100 ns molecular dynamics simulation. (F) Top 5 contributing residues of STAT3 SH2 domain to luteolin binding. (G) Overview of contributed residues of STAT3 SH2 domain to luteolin binding. (H) Detailed view of STAT3 SH2 domain to Luteolin binding. (n=3 in each group; ###P<0.001, vs vehicle group; *P<0.05, **P<0.01, ***P< 0.001, vs oxLDL group).
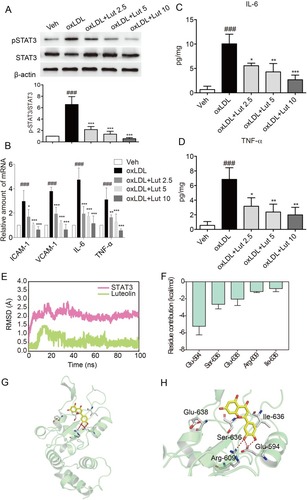
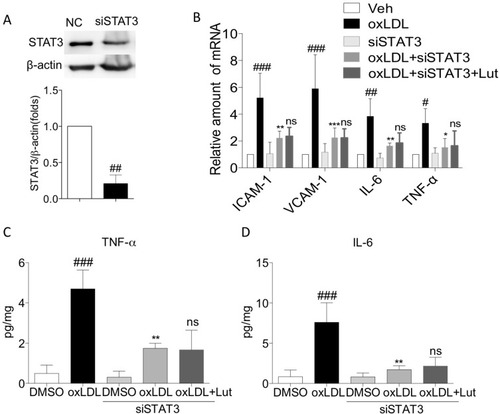
Figure 6 Luteolin suppressed oxLDL-induced inflammation via inhibiting activation of STAT3.
Notes: Primary macrophages treated with siRNA for STAT3. (A) Western blot analysis for silencing STAT3. (B) Pretreated with luteolin (10µM) for 1 hr, then stimulated with oxLDL (50 µg/mL) for 6 hrs, mRNA levels of ICAM-1, VCAM-1, IL-6 and TNF-α were detected by RT-qPCR analysis. (C, D) Pretreated with luteolin (10µM) for 1 hr, then stimulated with oxLDL (50 µg/mL) for 24 hrs, culture medium was used to detect the levels of IL-6 (C) and TNF-α (D) by ELISA (n=3 in each group; #P< 0.05, ##P<0.01, ###P<0.001, vs vehicle group; *P<0.05, **P<0.01, ***P<0.001, vs oxLDL group; ns, no significance, vs oxLDL+siSTAT3 group).