Figures & data
Figure 1 PRISMA flow diagram of the study selection process.
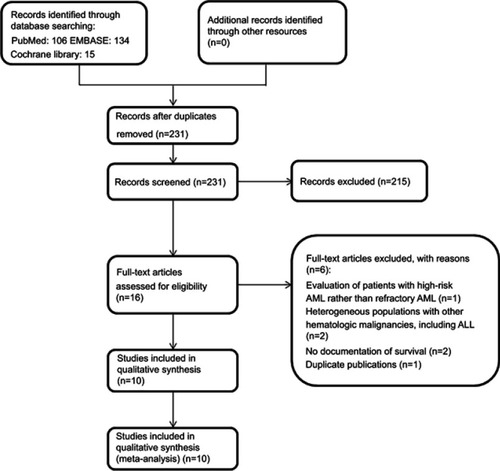
Table 1 Characteristics of the studies included in this meta-analysis
Figure 2 Forest plot of the estimated proportions (95% CI) for complete remission (CR) rate in patients.
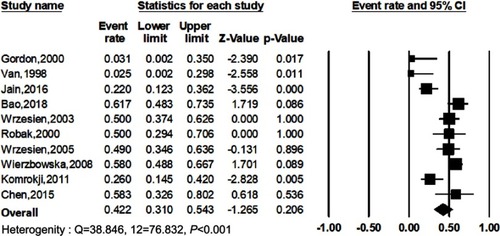
Figure 3 Forest plot of the estimated proportions (95% CI) for overall response rate (ORR) in patients.
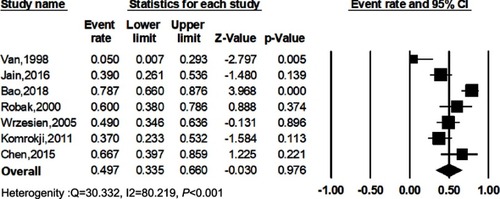
Figure 4 Forest plots of the estimated proportions of complete remission (CR) rate by cladribine monotherapy (A), CLAG-based chemotherapy (B), CLAG/CLAG-M chemotherapy (C), standard CLAG chemotherapy (D).
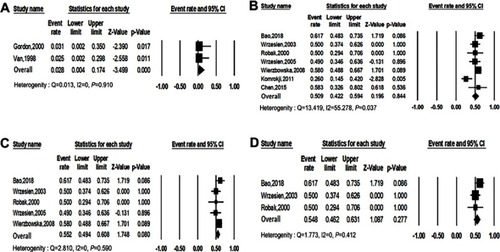
Figure 5 Forest plots of the estimated proportions of complete remission (CR) rate by favorable risk (A), intermediate risk (B), unfavorable risk (C).
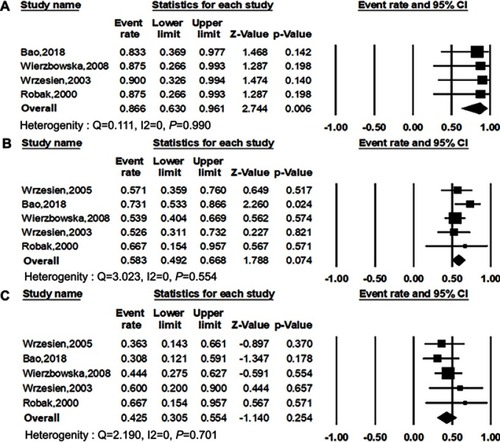
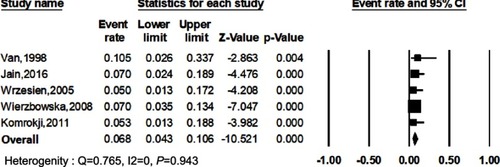
Figure 6 Forest plot of the estimated proportions (95% CI) for early death rate in patients.