Figures & data
Figure 1 Effects of liraglutide and telmisartan on body weight, blood sugar, MDA, SOD, NT-pro-BNP, and cardiac hypertrophy after abdominal aortic constriction (AAC). (A) body weight and blood glucose were measured among different groups. (B and C) Levels of MDA, SOD, and NT-pro-BNP activity in myocardial tissue were determined using Elisa kits. (D) MSA in series was measured morphometrically at a HPF (original magnification: 200; scale bars: 100 μm). (E) Heart/body weight ratio (HW/BW, mg/g) was calculated by weight. Values are mean±SEM (n=6/group). *p<0.05 AAC vs Sham; #p<0.05 liraglutide (Lira) or telmisartan (Telmi) vs AAC.
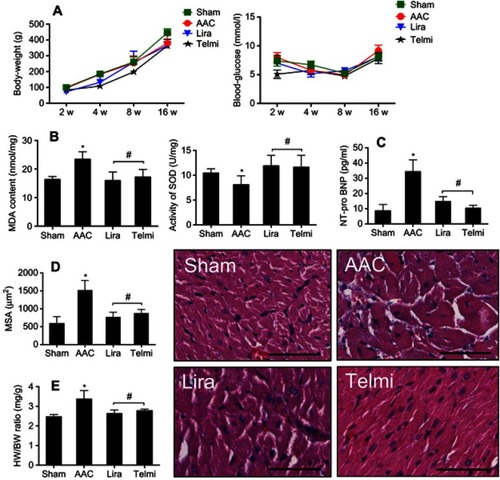
Figure 2 Effects of liraglutide and telmisartan on the expression of AT1R, AT2R, AT1R/AT2R ratio, and ACE2 after AAC. (A and B) Protein levels of AT1R and AT2R were detected by Western blot assay. (C) AT1R/AT2R ratio was calculated from the intensity of each individual bands. (D) ACE2 expression in the intermyocardium and intracardiac vessels was determined using immunohistochemical staining and calculated as mean optical density (MOD) in the tissue section (magnification: 200; scale bars: 100 μm). Values are mean±SEM (n=6/group). *p<0.05 AAC vs Sham; #p<0.05 Lira or Telmi vs AAC.
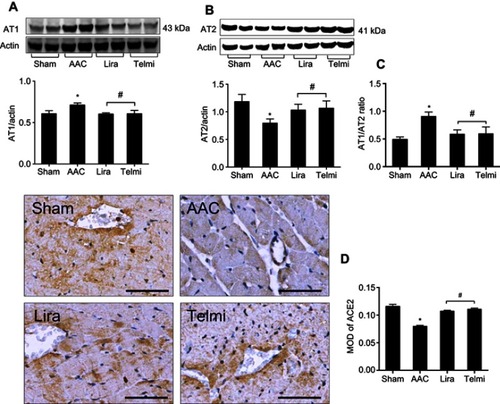
Figure 3 Effects of liraglutide and telmisartan on the accumulation of macrophages and the expression TGF-β1. (A) The numbers of macrophages were determined by positively stained cells (arrows) using immunohistochemistry. (B) TGF-β1 expression in the intermyocardium was determined using immunohistochemistry and calculated as MOD in the tissue section (magnification: 200; scale bars: 100 μm). (C) Protein level of TGF-β1 was detected by Western blot assay. Values are mean±SEM (n=6/group). *p<0.05 AAC vs Sham; #p<0.05 Lira or Telmi vs AAC.
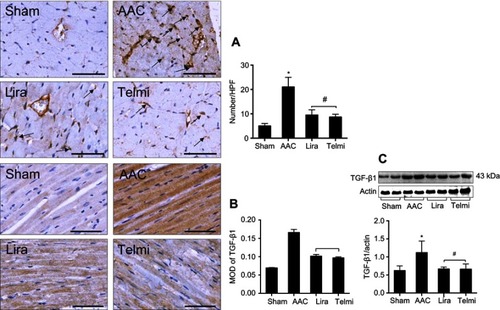
Figure 4 Effects of liraglutide and telmisartan on the proliferation of myofibroblasts and the expression of Smads. (A) The numbers of myofibroblasts were determined by α-SMA positive cells (arrows) using immunohistochemistry. (B) Phosphorylated and total protein levels of Smad2 and Smad3 were detected by Western blot assay. (C and D) Protein levels of Smad4 and Smad7 were detected by Western blot assay. Values are mean±SEM (n=6/group). *p<0.05 AAC vs Sham; #p<0.05 Lira or Telmi vs AAC.
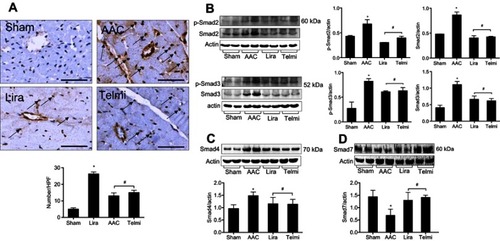
Figure 5 Effects of liraglutide and telmisartan on the synthesis of collagens and tissue fibrosis after AAC. (A and B) Protein levels of collagens I and III were analyzed by Western blot assay. All bands were normalized by actin as illustrated in the bar graphs. (C) Interstitial and perivascular fibrosis in the myocardium was identified as collagen deposition shown as positive areas of blue staining using Masson’s trichrome method. All images were viewed under magnification 200 (scale bars: 100 μm). Values are mean±SEM (n=6/group). *p<0.05 AAC vs Sham; #p<0.05 Lira or Telmi vs AAC.
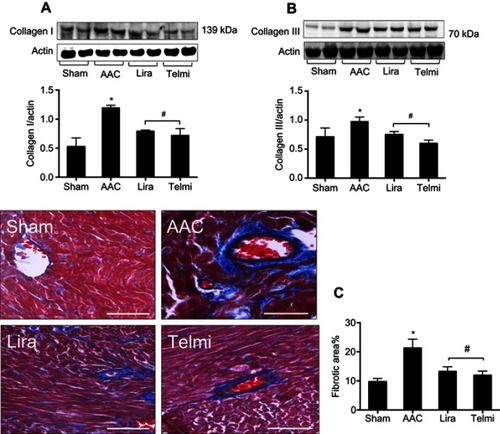
Figure 6 Effects of liraglutide and telmisartan on cardiac performance after AAC. (A) Cardiac global function was quantitatively assessed from two-dimensional echocardiographic short axis images among the different groups. (B) Left ventricular internal diameter end diastole (LVIDd) was measured at end-diastole. (C and D) Cardiac systolic function was determined by measuring ejection fraction (EF) and fraction shortening (FS). Values are mean±SEM (n=6/group). *p<0.05 AAC vs Sham; #p<0.05 Lira or Telmi vs AAC.
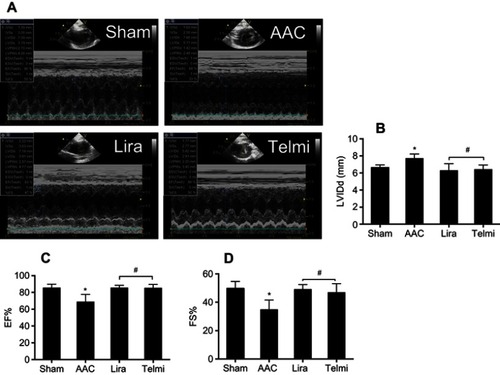
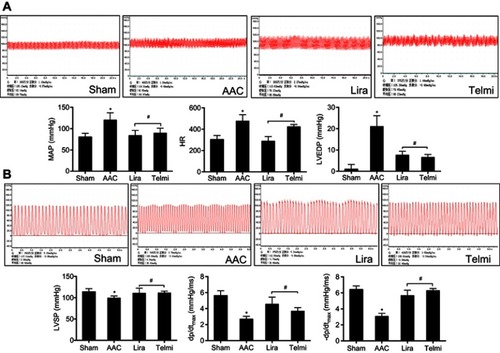
Figure 7 Effects of liraglutide and telmisartan on cardiac hemodynamics after AAC. (A) Representative tracing of the invasive cardiac hemodynamics recording among the different groups. MAP, HR, and left ventricular end-diastolic pressure (LVEDP) were obtained using a pressure transducer inserted into the left ventricle through the right carotid artery. (B) Left ventricular systolic pressure (LVSP) and ±dp/dtmax values of the first derivative of left ventricular pressure were obtained using a pressure transducer inserted into the left ventricle. Values are mean±SEM (n=6/group). *p<0.05 AAC vs Sham; #p<0.05 Lira or Telmi vs AAC.