Figures & data
Figure 1 IL-1β induced apoptosis in CHON-001 cells. (A) CHON-001 cells were treated with different concentrations (0, 2, 5, 10 or 20 ng/mL) of IL-1β for 0, 24, 48 and 72 hrs. Cell viability was determined using CCK-8 assay in CHON-001 cells. (B, C) CHON-001 cells were treated with different concentrations (0, 2, 5, 10 or 20 ng/mL) of IL-1β for 72 hrs. Apoptotic cells were detected with Annexin V and PI double staining. *P < 0.05, **P < 0.01 compared with control group.
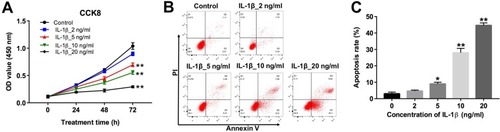
Figure 2 IL-1β induced extracellular matrix degradation in CHON-001 cells. CHON-001 cells were treated with IL-1β (10 ng/mL) for 72 hrs. (A) The levels of collagen II, aggrecan and MMP-13 in CHON-001 cells were detected using qRT-PCR. (B) Expression levels of collagen II, aggrecan, MMP-13, cleaved caspase 1 and Gasdermin D in CHON-001 cells were detected with Western blotting. GAPDH was used as an internal control. (C) The relative expressions of collagen II, aggrecan, MMP-13, cleaved caspase 1 and Gasdermin D were quantified via normalization to GAPDH. (D) The production of TNF-α was measured with ELISA. **P < 0.01 compared with control group.
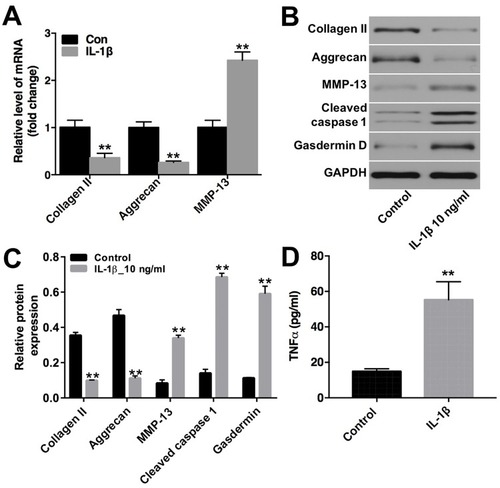
Figure 3 Tanshinone I inhibited IL-1β-induced apoptosis and inflammation in CHON-001 cells. (A) CHON-001 cells were treated with different concentrations (0, 10, 20 or 40 μM) of Tanshinone I for 24 hrs. Cell viability was detected using CCK-8 assay in CHON-001 cells. (B) CHON-001 cells were pre-treated with 10 μM celecoxib or (10 or 20 μM) Tanshinone I for 24 hrs and then stimulated with or without IL-1β (10 ng/mL) for 24, 48 and 72 hrs. Cell viability was detected using CCK-8 assay in CHON-001 cells. (C, D) CHON-001 cells were pre-treated with 10 μM celecoxib or (10 or 20 μM) Tanshinone I for 24 hrs and then stimulated with or without IL-1β (10 ng/mL) for 72 hrs. Apoptotic cells were detected with Annexin V and PI double staining. (E, F) Relative fluorescence expressions were quantified by Ki67 and DAPI staining. (G) ELISA was used to measure the production of TNF-α in CHON-001 cells. *P < 0.05, **P < 0.01 compared with control group; #P<0.05, ##P < 0.01 compared with IL-1β 10-ng/mL group.
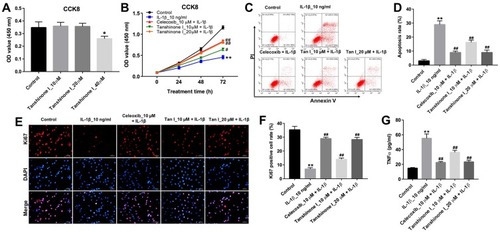
Figure 4 Tanshinone I prevented IL-1β-induced extracellular matrix degradation in CHON-001 cells. CHON-001 cells were pre-treated with 20 μM Tanshinone I for 24 hrs and then stimulated with or without IL-1β (10 ng/mL) for 72 hrs. (A) Expression levels of collagen II, aggrecan, MMP-13, SOX11 and p-NF-κB in CHON-001 cells were detected with Western blotting. GAPDH was used as an internal control. (B–E) The relative expressions of collagen II, aggrecan, MMP-13 and SOX11 were quantified via normalization to GAPDH. (F) The relative expression of p-NF-κB was quantified via normalization to NF-κB **P < 0.01 compared with control group; ##P < 0.01 compared with IL-1β 10-ng/mL group.
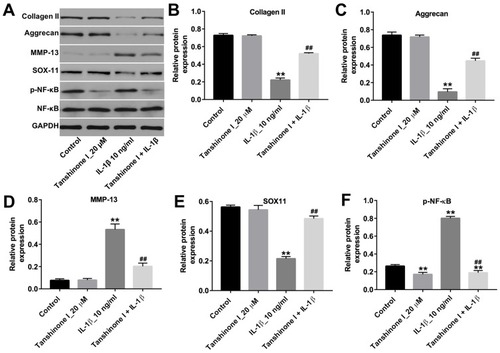
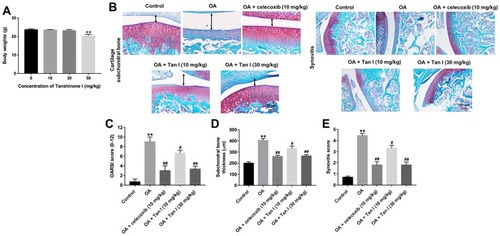
Figure 5 Tanshinone I alleviated OA progression in a murine OA model. (A) The mice were administrated with 10, 30 or 50 mg/kg Tanshinone I for 8 weeks. The body weights of mice were monitored at the end of the study. (B) The mice were randomly divided into five groups: sham (control) group, OA group, OA + celecoxib (10 mg/kg) group OA + Tanshinone I (10 mg/kg) group and OA + Tanshinone I (30 mg/kg) group. Histological analysis of OA was evaluated by Safranin-O/Fast Green staining. The black two-way arrow represents the subchondral bone thickness. (C) Osteoarthritis Research Society International (OARSI) scores, (D) subchondral bone plate thickness and (E) synovitis scores were used to measure the progression of OA. **P<0.01 compared with the control group, #P<0.05, ##P<0.01 compared with OA group.