Figures & data
Figure 1 Difference of swelling and gelation behaviors between (A) MM tablets and (B) TL tablets containing a water-penetrating layer.
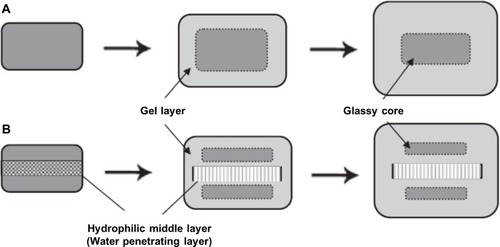
Table 1 Composition of CR Tablets of Pregabalin
Figure 2 Influence of the amount of PEO on the dissolution profiles of MM tablets in pH 1.2 buffer.
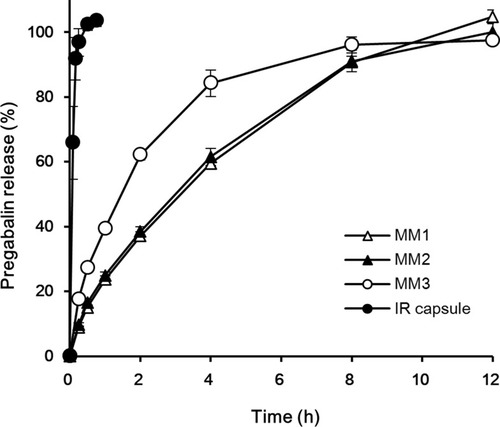
Figure 3 Drug release profiles comparing MM and TL tablets containing the same amount of PEO in a tablet in pH 1.2 buffer: (A) 300 mg; (B) 200 mg.
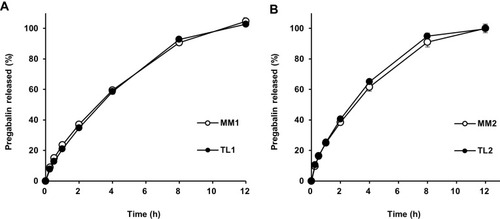
Table 2 Comparison of the Change in Tablet Size by Different Swelling Rates of CR Tablets at pH 1.2
Figure 4 Comparison of swelling rates between MM and TL tablets in pH 1.2 buffer.
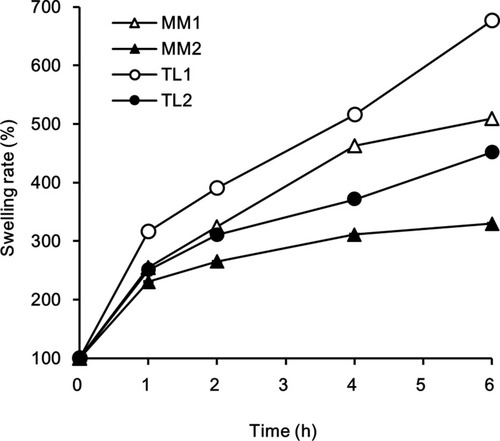
Table 3 Summary of Pregabalin Pharmacokinetic Parameters and Statistical Analysis Parameters in Beagles
Figure 5 Plasma concentration–time profiles of pregabalin after oral administration to beagles of the IR capsule (75 mg), twice a day, and the TL1 tablet (150 mg), once daily. Each value represents the mean ± S.D.
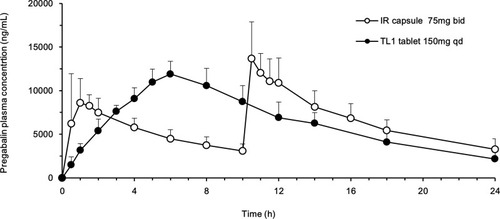
Table 4 Summary of Pregabalin Pharmacokinetic Parameters and Statistical Analysis Parameters in Humans
Figure 6 Plasma concentration–time profiles of pregabalin after oral administration to humans of the IR capsule (75 mg), twice a day, and the TL3 tablet (150 mg), once daily. Each value represents the mean ± S.D.
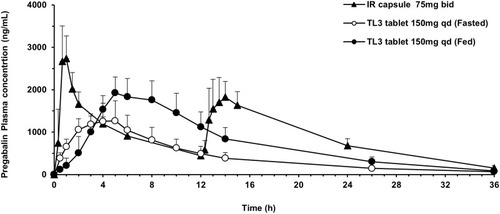
Figure 7 In vivo fraction-absorbed to IR capsule of TL1 and TL3 tablets and correlation between beagle and human fractions absorbed (Fed).
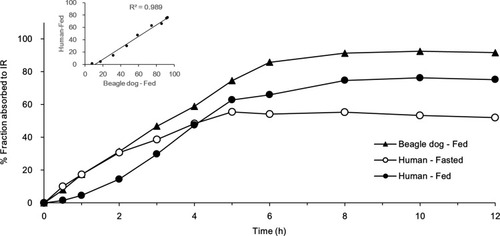
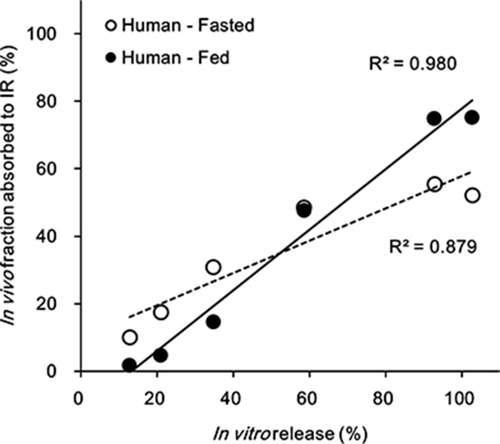
Figure 8 In vivo–in vitro correlation, level A, comparing the effect of food on the TL3 tablet in humans.