Figures & data
Figure 1 The chemical structure of parecoxib, valdecoxib and celecoxib (IS) (A) parecoxib, (B) valdecoxib, (C) celecoxib (IS).
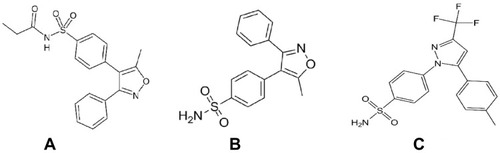
Table 1 MS Parameters of Two Analytes and IS
Figure 2 The ion transitions from parent ion to daughter ion of (A) Parecoxib, (B) valdecoxib, (C) Celecoxib.
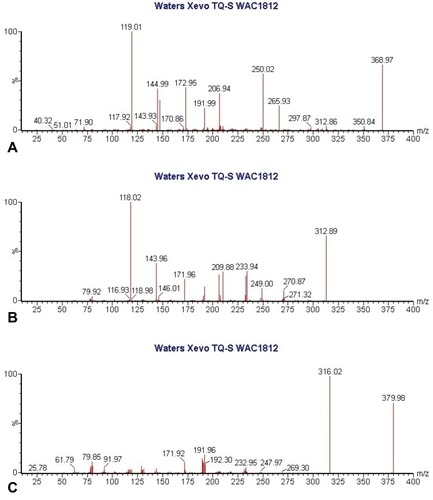
Figure 3 (A) a blank plasma sample, (B) a blank plasma sample spiked with parecoxib, valdecoxib and IS, (C) a beagle plasma sample 1.5 h after injection of parecoxib.
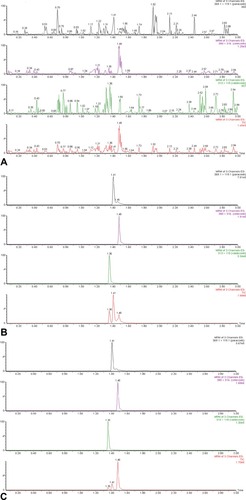
Table 2 Regression Equation, Linear Ranges, Correlation Coefficients and LLOQ of Two Analytes
Table 3 Precision and Accuracy of Parecoxib and Valdecoxib in Beagle Plasma (n=6, Mean ± SD)
Table 4 The Recoveries and ME of Parecoxib, Valdecoxib and IS in Beagle Plasma (n=6, Mean ± SD)
Table 5 The Stability of Parecoxib and Valdecoxib in Beagle Plasma (n=6, Mean ± SD)
Table 6 The Stock Solution Stability of Parecoxib, Valdecoxib and IS in Beagle Plasma (n=6)
Table 7 Pharmacokinetic Parameters of Parecoxib and Valdecoxib After Intramuscular Injection of 1.33 mg/kg Parecoxib (n=6, Mean ± SD)
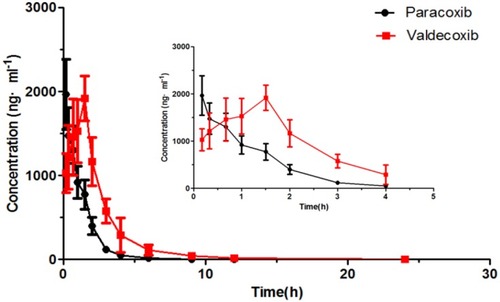
Figure 4 The mean plasma concentration-time curve of parecoxib and valdecoxib (zoomed 1 h to 4 h pharmacokinetic profile).